
Reason to trust
How Our News is Made
Strict editorial policy that focuses on accuracy, relevance, and impartiality
Ad discliamer
Morbi pretium leo et nisl aliquam mollis. Quisque arcu lorem, ultricies quis pellentesque nec, ullamcorper eu odio.
Dogecoin started a downside correction from the $0.1050 zone against the US Dollar. DOGE is now holding major support at $0.080 and might start a fresh increase.
- DOGE started a downside correction below the $0.090 support against the US dollar.
- The price is trading above the $0.080 zone and the 100 simple moving average (4 hours).
- There is a key bearish trend line forming with resistance near $0.084 on the 4-hours chart of the DOGE/USD pair (data source from Kraken).
- The pair could start a fresh increase if there is a clear move above $0.0840.
Dogecoin Price Revisits 100 SMA
After a major rally, Dogecoin’s price struggled to clear the $0.1050 resistance. DOGE started a major decline and traded below the $0.0920 support, trimming gains versus Bitcoin and Ethereum.
There was a sharp decline below the $0.090 level and the price even tested the $0.080 support. A low is formed near $0.0803 and the price is now consolidating losses. It is trading above the $0.080 zone and the 100 simple moving average (4 hours).
On the upside, the price is facing resistance near the $0.0840 level. There is also a key bearish trend line forming with resistance near $0.084 on the 4-hours chart of the DOGE/USD pair.
The first major resistance is near the $0.0862 level. It is near the 23.6% Fib retracement level of the downward move from the $0.1051 swing high to the $0.0803 low. A clear move above the $0.0862 resistance might send the price toward the $0.090 resistance.
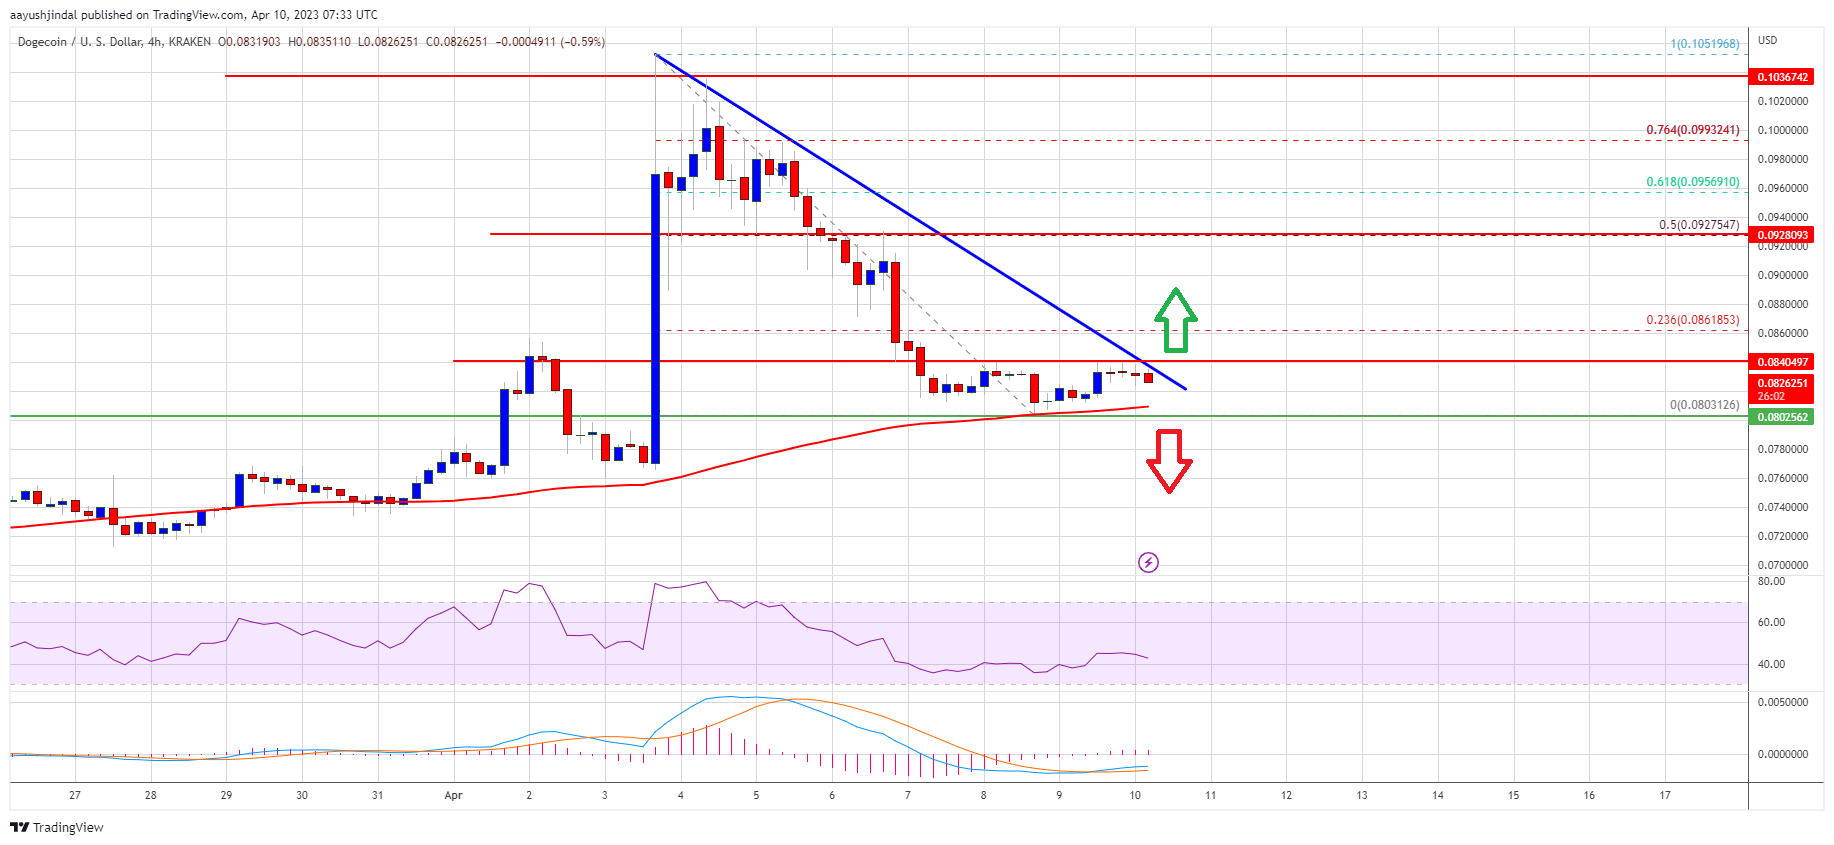
Source: DOGEUSD on TradingView.com
The next major resistance is near $0.0920 or the 50% Fib retracement level of the downward move from the $0.1051 swing high to the $0.0803 low. Any more gains might send the price toward the $0.095 level. A clear move above the $0.095 resistance could open the gates for an increase toward the $0.105 level.
More Losses in DOGE?
If DOGE’s price fails to gain pace above the $0.0862 level, it could continue to move down. Initial support on the downside is near the $0.080 level.
The next major support is near the $0.076 level. If there is a downside break below the $0.076 support, the price could decline further. In the stated case, the price might decline toward the $0.070 level.
Technical Indicators
4 Hours MACD – The MACD for DOGE/USD is now losing momentum in the bearish zone.
4 Hours RSI (Relative Strength Index) – The RSI for DOGE/USD is now below the 50 level.
Major Support Levels – $0.080, $0.076, and $0.070.
Major Resistance Levels – $0.0840, $0.0862, and $0.092.


