
Reason to trust
How Our News is Made
Strict editorial policy that focuses on accuracy, relevance, and impartiality
Ad discliamer
Morbi pretium leo et nisl aliquam mollis. Quisque arcu lorem, ultricies quis pellentesque nec, ullamcorper eu odio.
Dogecoin is gaining bullish momentum above the $0.070 resistance against the US Dollar. DOGE could extend its rally toward the $0.080 resistance zone.
- DOGE is currently showing positive signs above $0.068 resistance against the US dollar.
- The price is trading well above the $0.070 zone and the 100 simple moving average (4 hours).
- There is a key bullish trend line forming with support near $0.070 on the 4-hours chart of the DOGE/USD pair (data source from Kraken).
- The pair could start a fresh rally if it clears the $0.0732 resistance zone.
Dogecoin Price Could Rally Over 10%
After a downside correction, Dogecoin’s price found support near the $0.0680 zone. DOGE formed a base and recently started a fresh increase from $0.0675, outperforming Bitcoin and Ethereum.
In the past two sessions, there were bullish moves above the $0.070 resistance zone. The price climbed above the 50% Fib retracement level of the downward move from the $0.0750 swing high to the $0.0670 low. DOGE is now trading well above the $0.070 zone and the 100 simple moving average (4 hours).
There is also a key bullish trend line forming with support near $0.070 on the 4-hours chart of the DOGE/USD pair. On the upside, the price is facing resistance near the $0.0732 level.
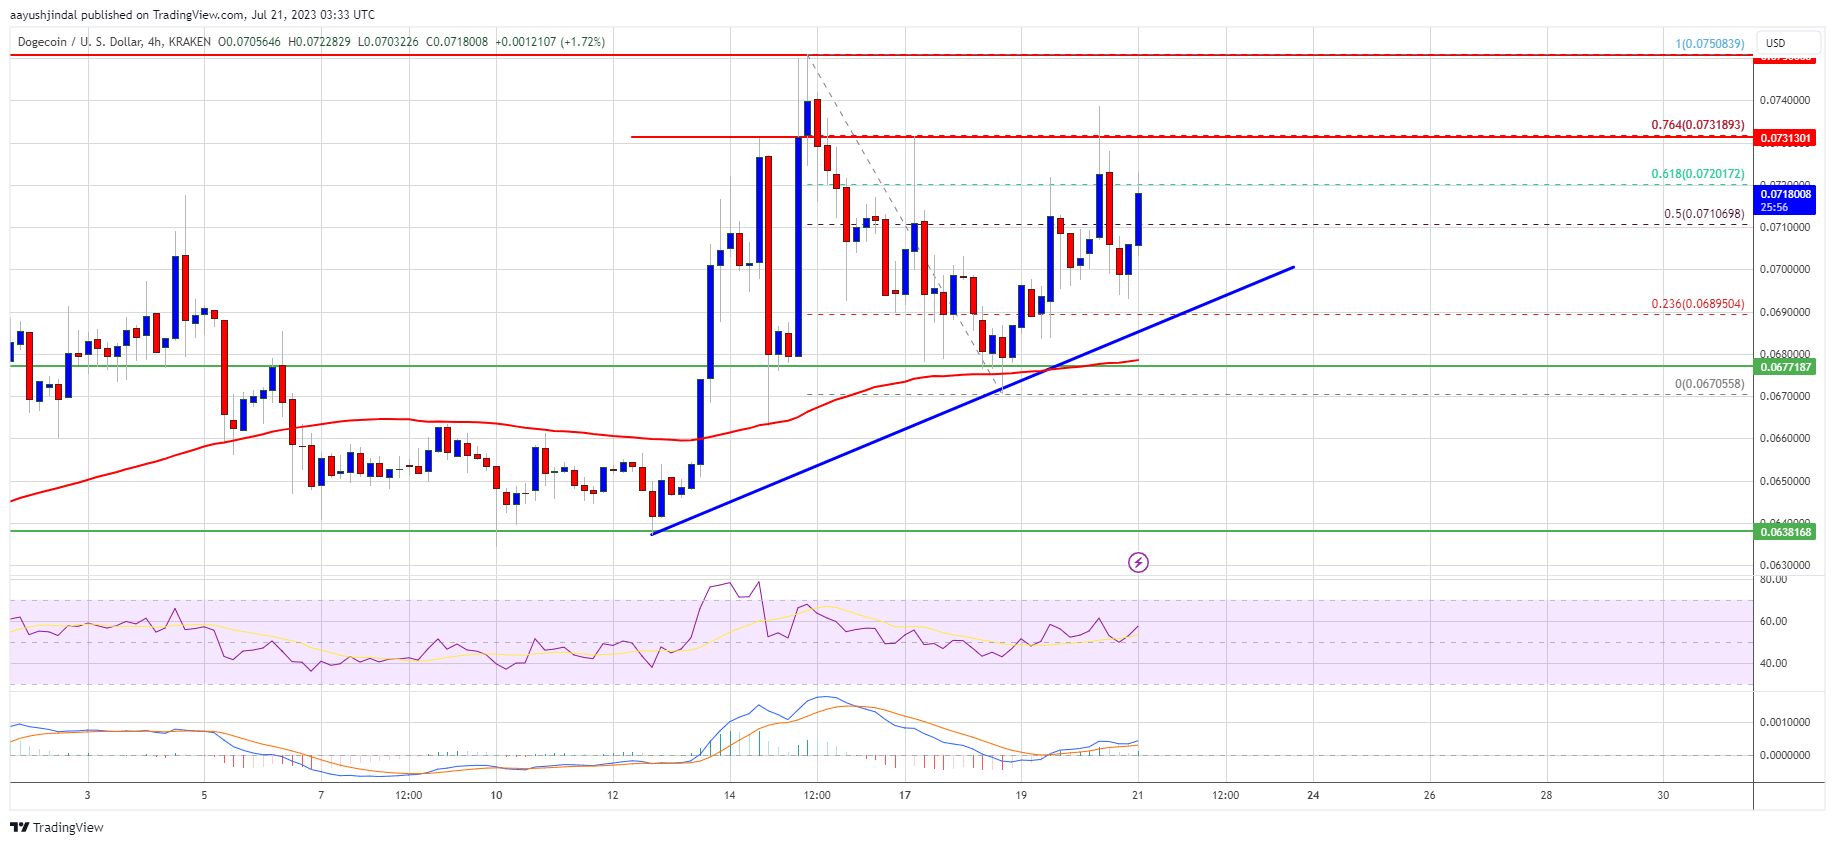
Source: DOGEUSD on TradingView.com
The 76.4% Fib retracement level of the downward move from the $0.0750 swing high to the $0.0670 low is also near the $0.0732 level. The first major resistance is near the $0.0750 level. A close above the $0.0750 resistance might send the price toward the $0.0780 resistance. The next major resistance is near $0.080. Any more gains might send the price toward the $0.082 level.
Fresh Decline in DOGE?
If DOGE’s price fails to gain pace above the $0.0732 level, it could start a downside correction. Initial support on the downside is near the $0.070 level and the trend line.
The next major support is near the $0.0675 level. If there is a downside break below the $0.0675 support, the price could decline further. In the stated case, the price might decline toward the $0.0650 level.
Technical Indicators
4 Hours MACD – The MACD for DOGE/USD is now gaining momentum in the bullish zone.
4 Hours RSI (Relative Strength Index) – The RSI for DOGE/USD is now above the 50 level.
Major Support Levels – $0.070, $0.0675, and $0.0650.
Major Resistance Levels – $0.0732, $0.0750, and $0.080.


