
Reason to trust
How Our News is Made
Strict editorial policy that focuses on accuracy, relevance, and impartiality
Ad discliamer
Morbi pretium leo et nisl aliquam mollis. Quisque arcu lorem, ultricies quis pellentesque nec, ullamcorper eu odio.
Dogecoin is climbing higher above the $0.065 resistance against the US Dollar. DOGE could rally over 20% if it clears the $0.070 resistance zone.
- DOGE started a decent increase above the $0.0625 resistance against the US dollar.
- The price is trading below the $0.0650 level and the 100 simple moving average (4 hours).
- There is a key bullish trend line forming with support near $0.0650 on the 4-hour chart of the DOGE/USD pair (data source from Kraken).
- The price could start a strong rally like Bitcoin if it clears the $0.070 resistance.
Dogecoin Price Starts Increase
After forming a base above the $0.0575 level, Dogecoin price started a fresh increase. DOGE broke the $0.060 resistance zone to move into a positive zone.
The recent pump in Bitcoin and Ethereum also pushed DOGE further higher. There was a steady increase above the $0.0650 resistance zone. A high is formed near $0.0693 and the price is now consolidating gains. It is also above the 23.6% Fib retracement level of the recent increase from the $0.0574 swing low to the $0.0693 high.
DOGE is now trading above the $0.065 level and the 100 simple moving average (4 hours). On the upside, the price is facing resistance near the $0.0685 level. There is also a key bullish trend line forming with support near $0.0650 on the 4-hour chart of the DOGE/USD pair.
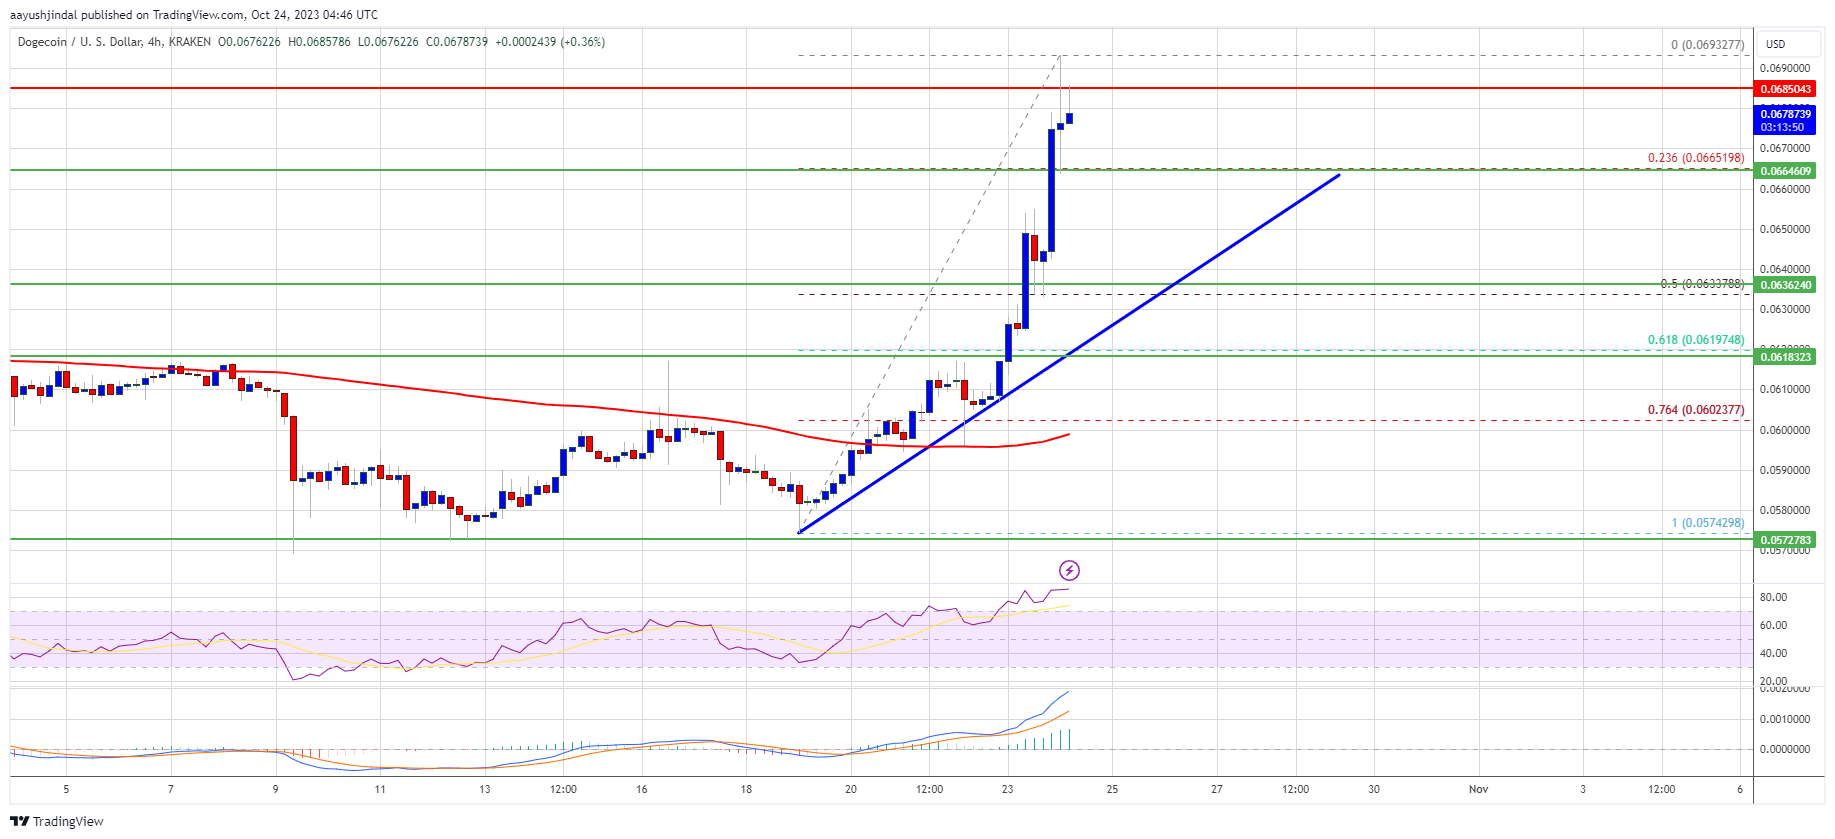
Source: DOGEUSD on TradingView.com
The first major resistance is near the $0.0685 level. The main resistance is near $0.070. A close above the $0.070 resistance might send the price toward the $0.0735 resistance. The next major resistance is near $0.0750. Any more gains might send the price toward the $0.080 level.
Are Dips Supported in DOGE?
If DOGE’s price fails to gain pace above the $0.070 level, it could start a downside correction. Initial support on the downside is near the $0.0665 level.
The next major support is near the $0.0650 level. If there is a downside break below the $0.0650 support, the price could decline further. In the stated case, the price might decline toward the $0.0632 level or the 50% Fib retracement level of the recent increase from the $0.0574 swing low to the $0.0693 high.
Technical Indicators
4 Hours MACD – The MACD for DOGE/USD is now gaining momentum in the bullish zone.
4 Hours RSI (Relative Strength Index) – The RSI for DOGE/USD is now above the 50 level.
Major Support Levels – $0.0665, $0.0650, and $0.0632.
Major Resistance Levels – $0.0685, $0.0700, and $0.0750.


