
Reason to trust
How Our News is Made
Strict editorial policy that focuses on accuracy, relevance, and impartiality
Ad discliamer
Morbi pretium leo et nisl aliquam mollis. Quisque arcu lorem, ultricies quis pellentesque nec, ullamcorper eu odio.
Dogecoin is down over 10% and trading below the $0.070 resistance against the US Dollar. DOGE could extend losses if there is a move below $0.065.
- DOGE is currently trading in a bearish zone below $0.072 against the US dollar.
- The price is trading well below the $0.070 zone and the 100 simple moving average (4 hours).
- There is a key bearish trend line forming with resistance near $0.071 on the 4-hours chart of the DOGE/USD pair (data source from Kraken).
- The price could correct higher but upsides might be limited above $0.072.
Dogecoin Price Extends Losses
After facing a strong rejection near $0.078, Dogecoin price started a fresh decline. DOGE declined over 10% and traded below the $0.0720 support zone to enter a bearish zone, similar to Bitcoin and Ethereum.
The price even settled below the $0.070 level. Finally, it tested the $0.065 zone. A low is formed near $0.0657 and the price is now consolidating losses. It is approaching the 23.6% Fib retracement level of the recent decline from the $0.0772 swing high to $0.0657 low.
DOGE is now trading well below the $0.070 zone and the 100 simple moving average (4 hours). There is also a key bearish trend line forming with resistance near $0.071 on the 4-hours chart of the DOGE/USD pair.
On the upside, the price is facing resistance near the $0.0685 level. The first major resistance is near the $0.070 level or the trend line. It is near the 50% Fib retracement level of the recent decline from the $0.0772 swing high to $0.0657 low.
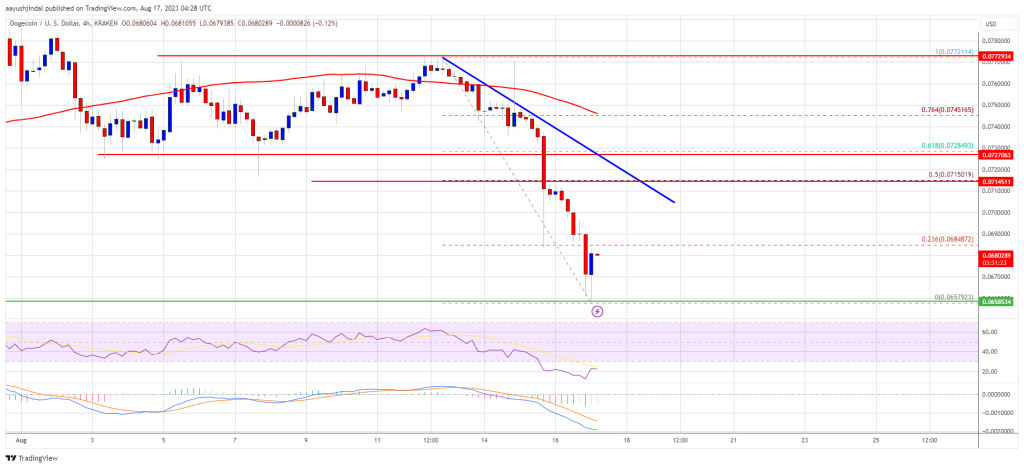
Source: DOGEUSD on TradingView.com
A close above the $0.072 resistance might send the price toward the $0.075 resistance. The next major resistance is near $0.0780. Any more gains might send the price toward the $0.080 level.
More Losses in DOGE?
If DOGE’s price fails to gain pace above the $0.0720 level, it could continue to move down. Initial support on the downside is near the $0.0655 level.
The next major support is near the $0.0632 level. If there is a downside break below the $0.0632 support, the price could decline further. In the stated case, the price might decline toward the $0.060 level.
Technical Indicators
4 Hours MACD – The MACD for DOGE/USD is now gaining momentum in the bearish zone.
4 Hours RSI (Relative Strength Index) – The RSI for DOGE/USD is now below the 50 level.
Major Support Levels – $0.0655, $0.0632, and $0.0600.
Major Resistance Levels – $0.070, $0.072, and $0.075.


