
Reason to trust
How Our News is Made
Strict editorial policy that focuses on accuracy, relevance, and impartiality
Ad discliamer
Morbi pretium leo et nisl aliquam mollis. Quisque arcu lorem, ultricies quis pellentesque nec, ullamcorper eu odio.
Dogecoin is recovering higher from the $0.060 level against the US Dollar. DOGE could continue to rise if it clears the $0.0640 resistance zone.
- DOGE started a decent increase above the $0.0615 resistance against the US dollar.
- The price is trading above the $0.062 level and the 100 simple moving average (4 hours).
- There is a key rising channel forming with resistance near $0.0640 on the 4-hour chart of the DOGE/USD pair (data source from Kraken).
- The price could struggle to clear the $0.0638 and $0.0640 resistance levels.
Dogecoin Price Starts Recovery
After a major decline, Dogecoin price found support near the $0.0595 zone. DOGE traded as low as $0.0591 and recently started a recovery wave. There was a decent move above $0.0600 and the price settled above $0.0612.
Recently, Bitcoin saw a steady increase above $27,000 and helped altcoins in recovery. Dogecoin is also showing a few positive signs and was able to clear the $0.062 resistance. There was a move above the 23.6% Fib retracement level of the downward move from the $0.0685 swing high to the $0.0591 low.
DOGE is now trading above the $0.062 level and the 100 simple moving average (4 hours). On the upside, the price is facing resistance near the $0.0638 level. It is close to the 50% Fib retracement level of the downward move from the $0.0685 swing high to the $0.0591 low.
The first major resistance is near the $0.0640 level. Besides, there is a key rising channel forming with resistance near $0.0640 on the 4-hour chart of the DOGE/USD pair.
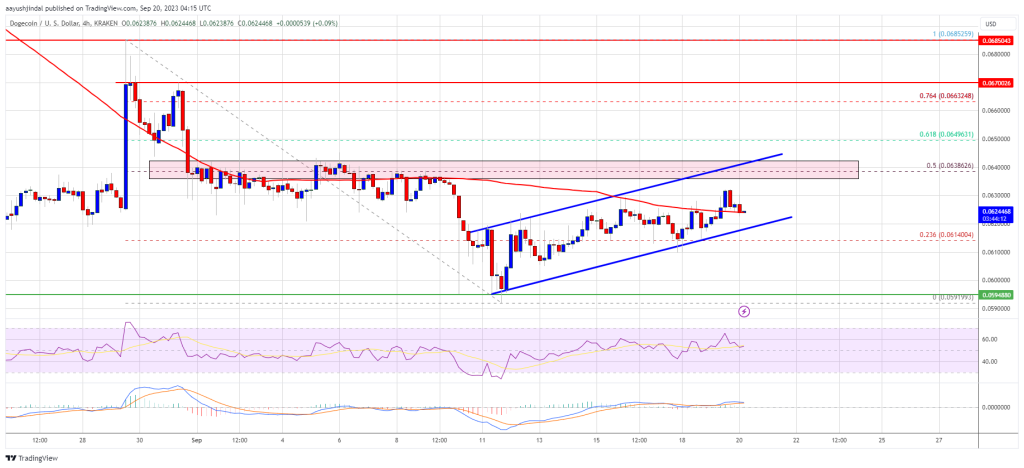
Source: DOGEUSD on TradingView.com
A close above the $0.0620 resistance might send the price toward the $0.0670 resistance. The next major resistance is near $0.0685. Any more gains might send the price toward the $0.072 level.
Are Dips Supported in DOGE?
If DOGE’s price fails to gain pace above the $0.0640 level, it could start a downside correction. Initial support on the downside is near the $0.0620 level.
The next major support is near the $0.060 level. If there is a downside break below the $0.060 support, the price could decline further. In the stated case, the price might decline toward the $0.0565 level.
Technical Indicators
4 Hours MACD – The MACD for DOGE/USD is now losing momentum in the bullish zone.
4 Hours RSI (Relative Strength Index) – The RSI for DOGE/USD is now above the 50 level.
Major Support Levels – $0.0620, $0.0600, and $0.0565.
Major Resistance Levels – $0.0638, $0.0640, and $0.0685.


