
Reason to trust
How Our News is Made
Strict editorial policy that focuses on accuracy, relevance, and impartiality
Ad discliamer
Morbi pretium leo et nisl aliquam mollis. Quisque arcu lorem, ultricies quis pellentesque nec, ullamcorper eu odio.
Dogecoin declined below the $0.14 support against the US Dollar. DOGE tested the $0.070 support and now aims a fresh move above the $0.10 resistance.
- DOGE started a fresh decline below the $0.14 and $0.12 levels against the US dollar.
- The price is trading well below the $0.110 zone and the 100 simple moving average (4-hours).
- There was a break above a key bearish trend line with resistance near $0.088 on the 4-hours chart of the DOGE/USD pair (data source from Kraken).
- The pair must stay above the $0.070 support zone to avoid more losses.
Dogecoin Price Aims Fresh Increase
In the past few days, dogecoin saw a major decline from well above the $0.14 level. DOGE declined below the $0.12 and $0.10 support levels, similar bitcoin and ethereum.
The price even broke the $0.085 support and tested the $0.07 support zone. A low was formed near $0.0699 before the bulls took a stand. The price formed a base above the $0.07 level and recently started a recovery wave.
There was a move above the $0.075 and $0.080 levels. Besides, there was a break above a key bearish trend line with resistance near $0.088 on the 4-hours chart of the DOGE/USD pair. The price is now trading well below the $0.110 zone and the 100 simple moving average (4-hours).
On the upside, the price is facing resistance near the $0.0915 level. It is near the 23.6% Fib retracement level of the downward move from the $0.1609 swing high to $0.0699 low.
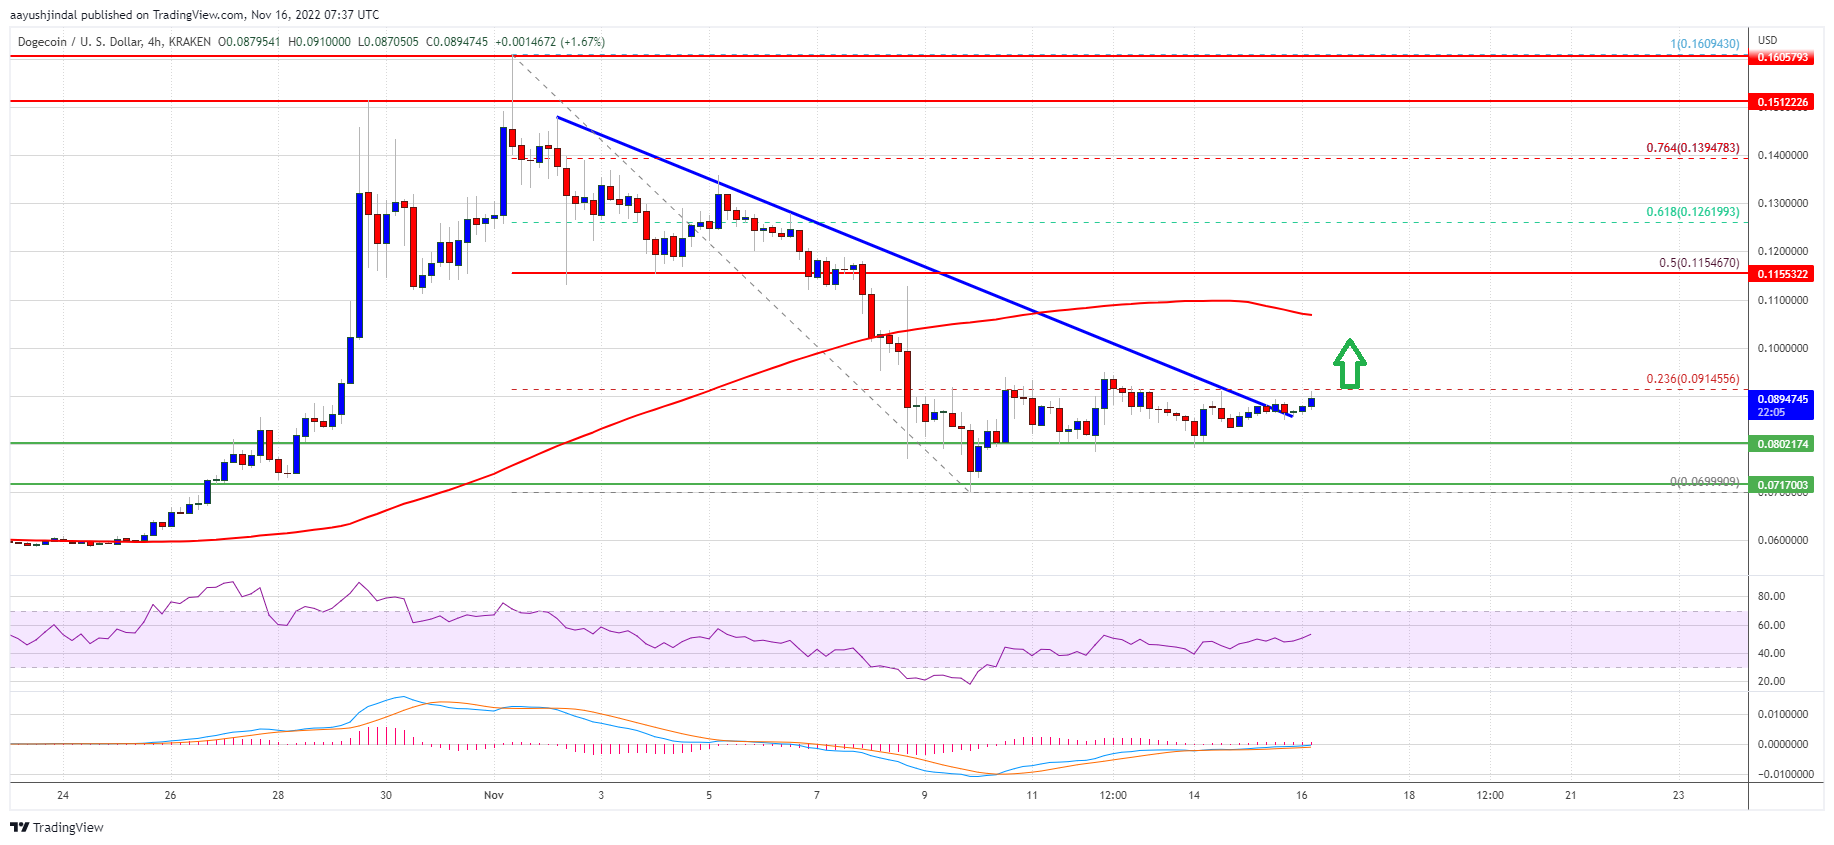
Source: DOGEUSD on TradingView.com
The first major resistance is near the $0.1100 level and the 100 simple moving average (4-hours). Any more gains above the $0.1100 zone could encourage the bulls to aim a test the 50% Fib retracement level of the downward move from the $0.1609 swing high to $0.0699 low at $0.115.
Fresh Decline in DOGE?
If DOGE price fails to gain pace above the $0.10 level, it could start another decline. An initial support on the downside is near the $0.0820 level.
The next major support is near the $0.070 level. If there is a downside break below the $0.070 support, the price could decline further. The main support is near the $0.0500 level. Any more losses could open the doors for a move towards the $0.0450 level.
Technical Indicators
4-Hours MACD – The MACD for DOGE/USD is now gaining momentum in the bullish zone.
4-Hours RSI (Relative Strength Index) – The RSI for DOGE/USD is now above the 50 level.
Major Support Levels – $0.0850, $0.0800 and $0.0700.
Major Resistance Levels – $0.0915, $0.1000 and $0.1100.


