Reason to trust

How Our News is Made
Strict editorial policy that focuses on accuracy, relevance, and impartiality
Ad discliamer
Morbi pretium leo et nisl aliquam mollis. Quisque arcu lorem, ultricies quis pellentesque nec, ullamcorper eu odio.
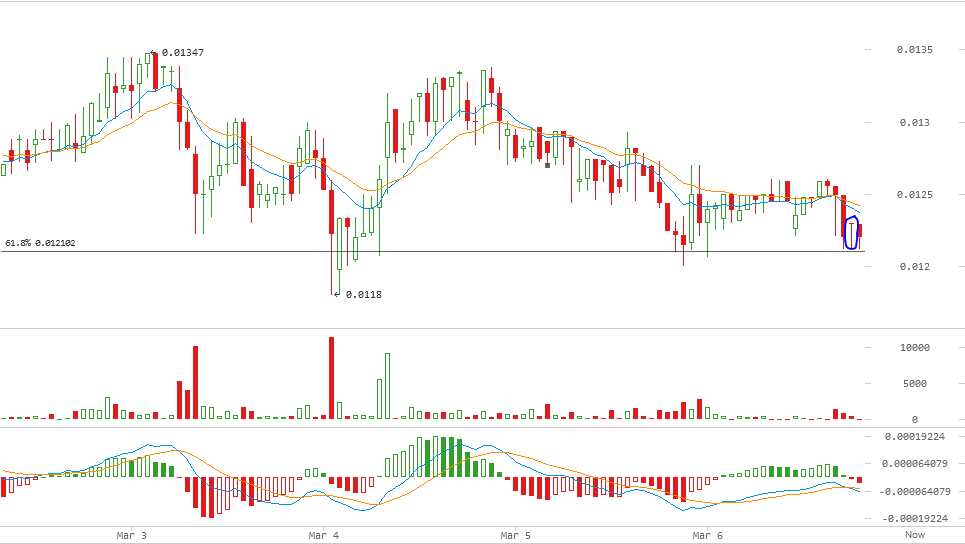
Darkcoin price remained between 0.01200 and 0.01270 BTC throughout yesterday’s trading sessions almost as we predicted during yesterday’s analysis. By the time of writing of this article, DRK price is about to retest the 61.8% Fibonacci retracement level at 0.012102 BTC.
By studying the 1 hour Cryptsy (DRK/BTC) chart from bitcoinwisdom.com and plotting the 10 hour EMA (green curve) and the 20 hour EMA (orange curve) (look at the below chart), we can conclude the following:
- DRK price is declining to test the 61.8% Fibonacci retracement level at 0.012102 BTC during the next few hours; however, as shown by the relatively long downwards shadows of the candlesticks and the “doji” that formed as the price approached this support level (look at the candlestick inside the blue cloud on the below chart), it seems that this seemingly strong support level will resist a further decline.
- Although the trading volume has just started to increase a couple of hours ago, it’s still not sufficient to induce a bigger move into the bullish or bearish sides.
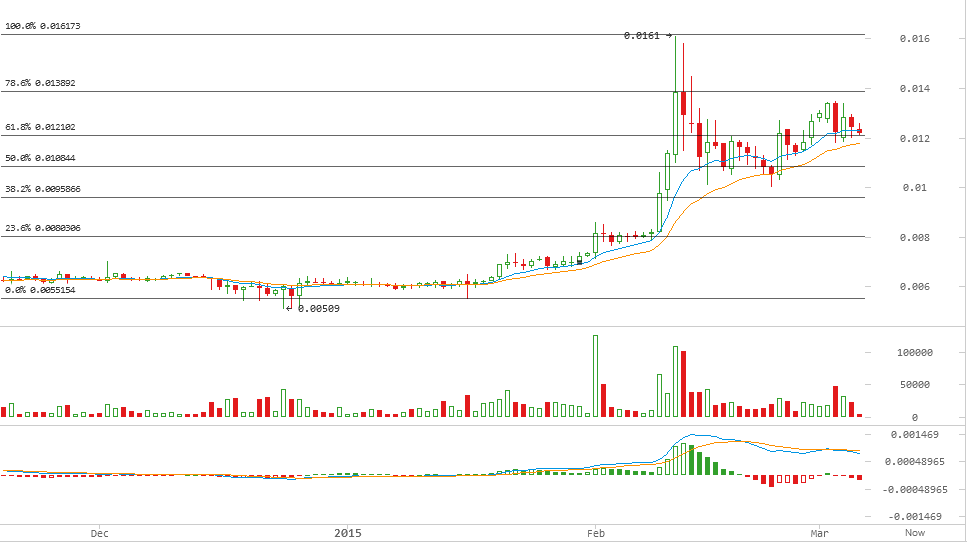
By studying the 1 day Cryptsy (DRK/BTC) chart from bitcoinwisdom.com and plotting the 10 day EMA (green curve) and the 20 day EMA (look at the below chart), we can conclude the following:
- Darkcoin price is now below the 10 and 20 day EMAs which reflects the recent bearish momentum of the market.
- Although the MACD indicator is in the positive territory, the red signal line is above the blue MACD line, so a bullish run cannot be expected during the next 24 hours or so.
Conclusion:
Darkcoin price is retesting support at 0.012102 BTC which coincides with the 61.8% Fibonacci retracement level. As the trading volume is still relatively low, we predict DRK price to continue trading above the 0.012102 BTC support level.
Charts from Cryptsy


