Reason to trust

How Our News is Made
Strict editorial policy that focuses on accuracy, relevance, and impartiality
Ad discliamer
Morbi pretium leo et nisl aliquam mollis. Quisque arcu lorem, ultricies quis pellentesque nec, ullamcorper eu odio.
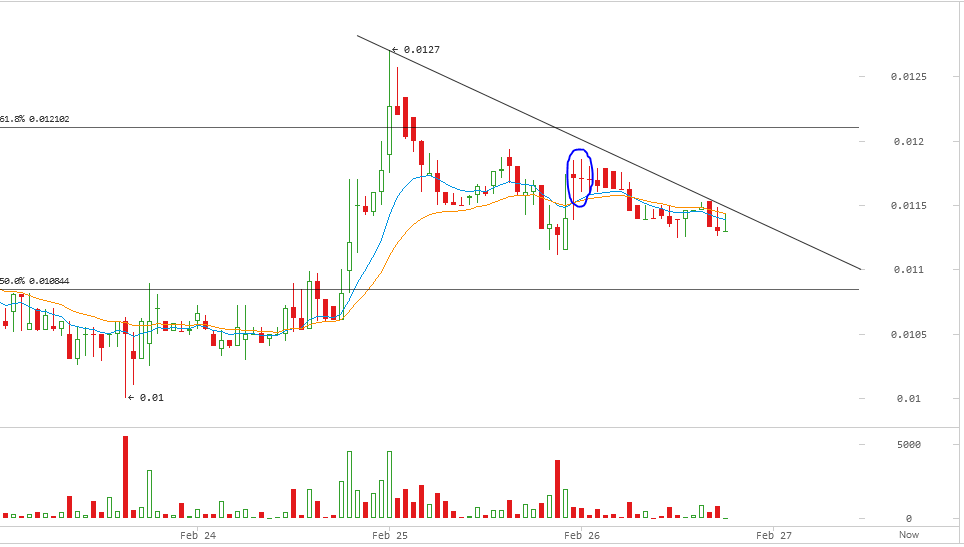
Darkcoin price has been trading between 0.01114 BTC and 0.1192 BTC on Cryptsy throughout yesterday’s trading sessions. Just like we anticipated during our yesterday’s analysis, the price has been moving midway between the 62% and the 50% Fibonacci retracement levels after the bullish wave we saw on the 25th of February.
By analyzing the 1 hour Cryptsy (DRK/BTC) chart from bitcoinwisdom.com, plotting the 10 hour EMA (green curve) and the 20 hour EMA (orange curve) and plotting the MACD indicator accordingly (look at the below chart), we can conclude the following:
- The price is now below the 10 hour and 20 hour EMAs and according to the trend line forming between the high reached on the 24th of February and today’s high (look at the black trend line on the below chart), it seems that the price will drop again to test the 50% Fibonacci retracement fan level at 0.010844 BTC.
- Following the bullish rally that we witnessed during the 25th of February, the price hasn’t broken out of the 0.01186 BTC level which is resisting increase as shown by the “dojis” and long shadows of candlesticks on the 1 hour (look at the candlesticks inside the blue cloud on the below chart).
Accordingly, darkcoin price may continue to trade midway between the 50% and 62% Fibonacci retracement levels before testing support at 0.010844 BTC within the next 24 hours.
Conclusion:
Darkcoin price has been trading between the 50% and 62% Fibonacci retracement levels during the past 48 hours. Technical analysis of the charts anticipates a bearish dip that can take the price down to test the 50% Fibonacci retracement level at 0.010844 again during the upcoming 24 hours.
Charts from Cryptsy


