Reason to trust

How Our News is Made
Strict editorial policy that focuses on accuracy, relevance, and impartiality
Ad discliamer
Morbi pretium leo et nisl aliquam mollis. Quisque arcu lorem, ultricies quis pellentesque nec, ullamcorper eu odio.
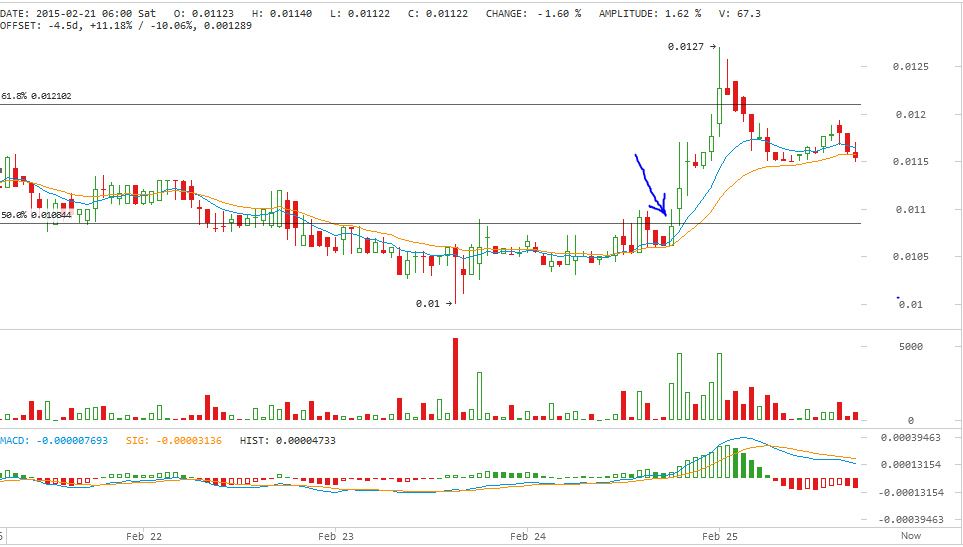
Yesterday, darkcoin price rallied and recorded a high of 0.0127 BTC to overshoot above the 62% Fibonacci retracement fan level, before dropping below it to record a low of 0.01150 BTC earlier today.
By analyzing the 1 hour Cryptsy (DRK/BTC) chart from bitcoinwisdom.com, plotting the 10 hour EMA (green curve) and the 20 hour EMA (orange curve) and plotting the MACD indicator (look at the below chart), we can conclude the following:
- Darkcoin price broke through the 50% Fibonacci retracement fan level at 0.010844 BTC at around 17:00 GMT yesterday and the bullish rally continued pushing the price upwards to also breech the next resistance level at the 62% Fibonacci retracement fan level at 0.012102 BTC.
- After recording a high of 0.0127 BTC, DRK price dropped below the 62% Fibonacci fan level earlier today and is now trading almost midway between the 62% and 50% Fibonacci retracement fan levels.
- DRK price rose above the 10 hour and 20 hour EMA right before the bullish wave pushed the price to higher levels as denoted by the blue arrow on the below chart. We can also spot the high trading volume during today’s and yesterday’s trading sessions.
- Although interpretation of the MACD indicator of 1 hourly charts cannot be valuable, we can notice that the blue MACD indicator has crossed above the red signal line before the bullish wave controlled the market. This signal can be used during the upcoming few days to predict similar bullish rallies.
Conclusion:
Darkcoin price exhibited a bullish rally yesterday that pushed the price upwards to break the 50% and 62% Fibonacci retracement levels successively. Price will most probably move in between these 2 levels for some time before attempting to test the 62% fan level again.
Charts from Cryptsy


