Reason to trust

How Our News is Made
Strict editorial policy that focuses on accuracy, relevance, and impartiality
Ad discliamer
Morbi pretium leo et nisl aliquam mollis. Quisque arcu lorem, ultricies quis pellentesque nec, ullamcorper eu odio.
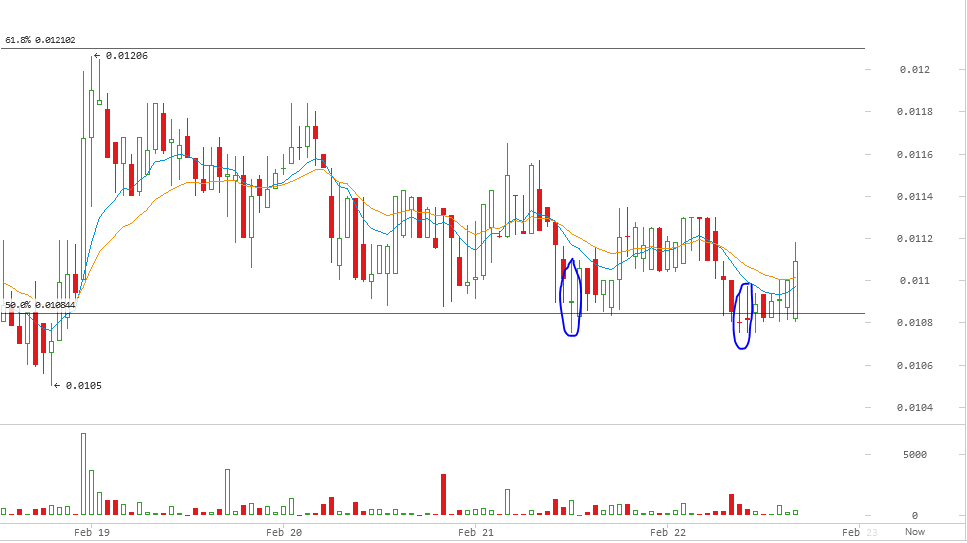
Darkcoin price dropped yesterday to test the 50% Fibonacci retracement fan level at 0.010844, as we predicted during Friday’s analysis, yet this level continued to prove that it is supporting Darkcoin price well. Yesterday, DRK price recorded a low of 0.01075 BTC and a high of 0.01165 BTC.
By studying the 1 hour Cryptsy (DRK/BTC) chart from bitcoinwisdom.com, plotting the 10 hour EMA (green curve) and the 20 hour EMA (orange curve) and calculating the MACD indicator (look at the below chart), we can conclude the following:
- Darkcoin price dropped yesterday to test the 0.010844 support level. Although price overshot below the support level to score a low of 0.01075 BTC, the downtrend reversed right away pushing the price up away from this seemingly strong support level.
- DRK price was trading below the 10 hour and 20 hour EMA earlier yesterday, but it rose above both during the later trading sessions.
- Based on yesterday’s chart, we can safely trade the “doji”; the green doji (look at the bullish doji inside the blue cloud on the below chart) proceeded reversal of the downtrend and the two bearish dojis (look at the 2 red dojis inside the blue cloud on the below chart) also proceeded the bullish wave that pushed the price above 0.011 BTC earlier today.
DRK price seems to follow a repetitive pattern that prefers to travel midway between the 50% and 62% Fibonacci retracement fan levels.
Conclusion:
Darkcoin price continues to move sideways to the 50% Fibonacci retracement fan level; however, as the 0.010844 BTC is continuing to support the price, we can see DRK price reach 0.0116 BTC later today.


