Reason to trust

How Our News is Made
Strict editorial policy that focuses on accuracy, relevance, and impartiality
Ad discliamer
Morbi pretium leo et nisl aliquam mollis. Quisque arcu lorem, ultricies quis pellentesque nec, ullamcorper eu odio.
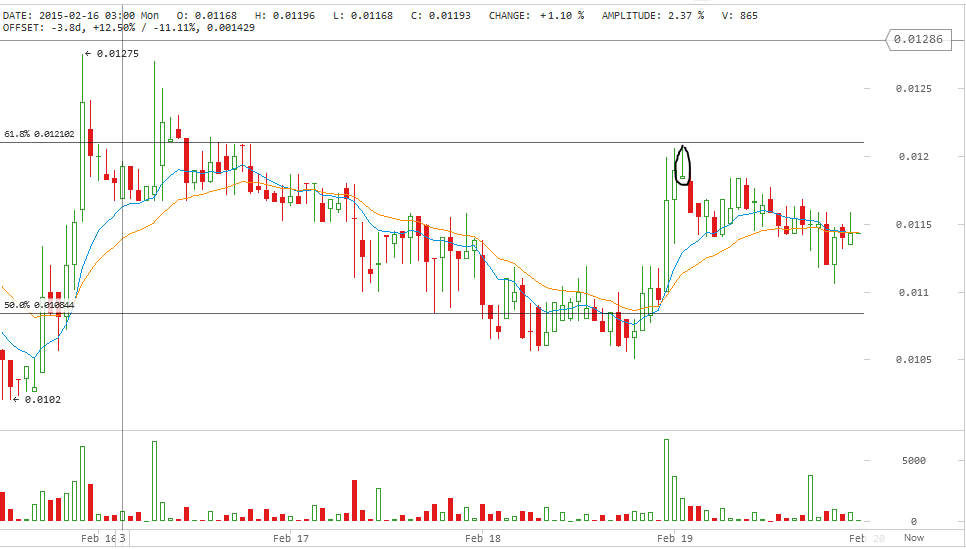
Darkcoin price increased yesterday after testing the 50% Fibonacci retracement level at 0.010844 BTC which continued to prove to be a strong support level throughout the past few days.
By studying the 1 hour Cryptsy (DRK/BTC) chart from bitcoinwisdom.com and plotting the 10 day EMA (green curve) and the 20 day EMA (orange curve) (look at the below chart), we can conclude the following:
- DRK price increased to around 0.01207 yesterday and it almost touched the 62% Fibonacci retracement level at 0.012102 BTC which resisted further advance.
- The “gravestone” doji” (look at the candlestick circled by the black cloud on the following chart) proceeded the downtrend and should have been used as a signal to closed long positions before price drop. Also, note the long shadows of the candlesticks as the price approached the 62% Fibonacci retracement level (0.012102) which reflects the strength of resistance at this level at the moment.
- Before yesterday’s bullish rally started, Darkcoin price increased above the 10 day EMA and 20 day EMA; however, at the time of writing of this article, the price is below both averages.
- Today’s trading volume was greater than yesterday’s, so if the volume remains to be low, we would likely see the price between the 0.010844 and 0.012102 BTC range.
Whether or not today’s bitcoin price rise can have an effect on the price of DRK is yet to be determined during the upcoming hours. However, DRK price is usually independent from that of bitcoin.
Conclusion:
Darkcoin price tested the 0.012102 BTC resistance level earlier today. Our technical analysis concludes that DRK price will probably trade between 0.010844 and 0.012102 BTC range during the following few days.
Chart from Cryptsy


Today’s trading volume was greater than today’s, … ??
Here’s hoping that tomorrow’s will be greater than tomorrow’s 🙂 (Must be something to do with doctors)