
Reason to trust
How Our News is Made
Strict editorial policy that focuses on accuracy, relevance, and impartiality
Ad discliamer
Morbi pretium leo et nisl aliquam mollis. Quisque arcu lorem, ultricies quis pellentesque nec, ullamcorper eu odio.
Binance coin price started a fresh rally above the $280 resistance against the USDT. BNB is now trading above $300 and it might continue to rise towards $350 or $400.
- Binance coin price started a fresh rally above the $260 and $280 resistance levels against the USDT.
- The price is now trading well above $280 and the 100 simple moving average (4-hours).
- There is a major bullish trend line forming with support near $290 on the 4-hours chart of the BNB/USDT pair (data source from Binance).
- The pair is likely to resume its upward move above the $315 and $320 resistance levels in the near term.
Binance Coin Price Breaks $300
After forming a base above $220, binance coin started a fresh increase. BNB broke the main $250 resistance and recently surpassed the $275 pivot level.
The bulls were able to lead the price above the $280 barrier and the 100 simple moving average (4-hours). As a result, there was a break above the $300 level. The price traded to a new monthly high at $317 and it is currently correcting gains.
It broke the $305 support level. There was also a break below the 23.6% Fib retracement level of the upward move from the $269 swing low to $317 high.
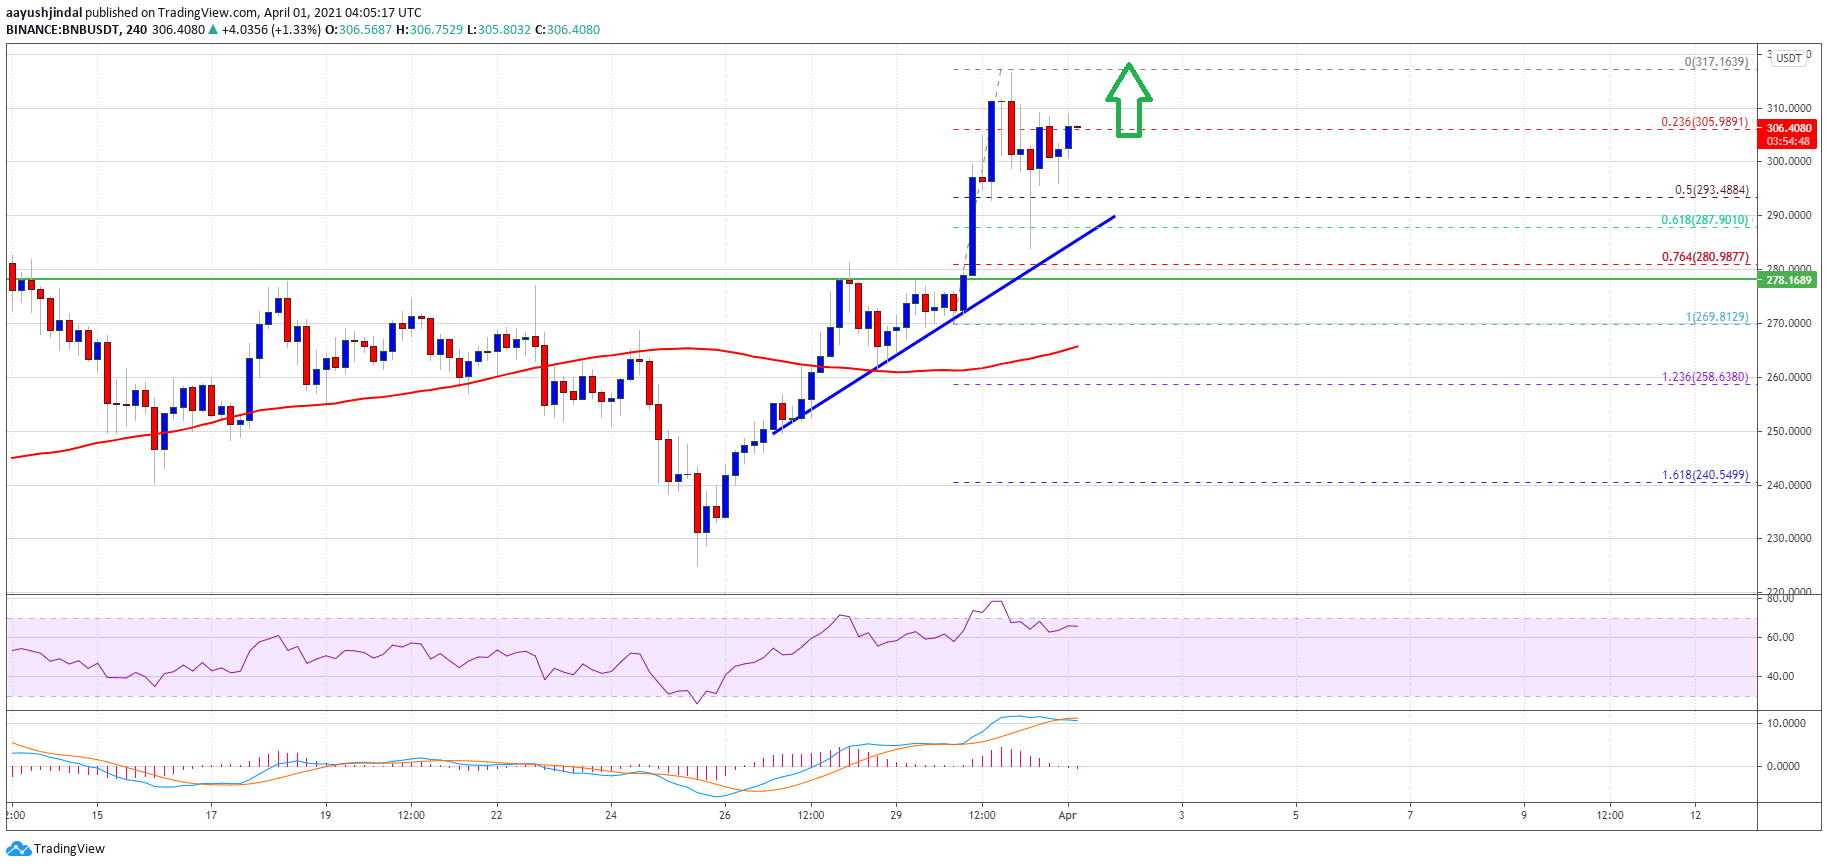
Source: BNBUSDT on TradingView.com
On the downside, the first major support is near the $290 level. It is close to the 50% Fib retracement level of the upward move from the $269 swing low to $317 high. There is also a major bullish trend line forming with support near $290 on the 4-hours chart of the BNB/USDT pair.
On the upside, the bulls are facing resistance near the $315 and $320 levels. The next major resistance is near the $340 level, above which the price is likely to set a new all-time high in the near term.
Dips Supported in BNB?
If BNB fails to continue higher above $315 and $320, there could be a fresh downside correction. The first major support is near the $295 level.
The next major support is near the $290 level and the trend line. If there is a downside break below the trend line support, there could be a drop towards the $280 support zone.
Technical Indicators
4-Hours MACD – The MACD for BNB/USDT is gaining pace in the bullish zone.
4-Hours RSI (Relative Strength Index) – The RSI for BNB/USDT is currently well above the 50 level.
Major Support Levels – $295, $290 and $280.
Major Resistance Levels – $315, $320 and $340.


