
Reason to trust
How Our News is Made
Strict editorial policy that focuses on accuracy, relevance, and impartiality
Ad discliamer
Morbi pretium leo et nisl aliquam mollis. Quisque arcu lorem, ultricies quis pellentesque nec, ullamcorper eu odio.
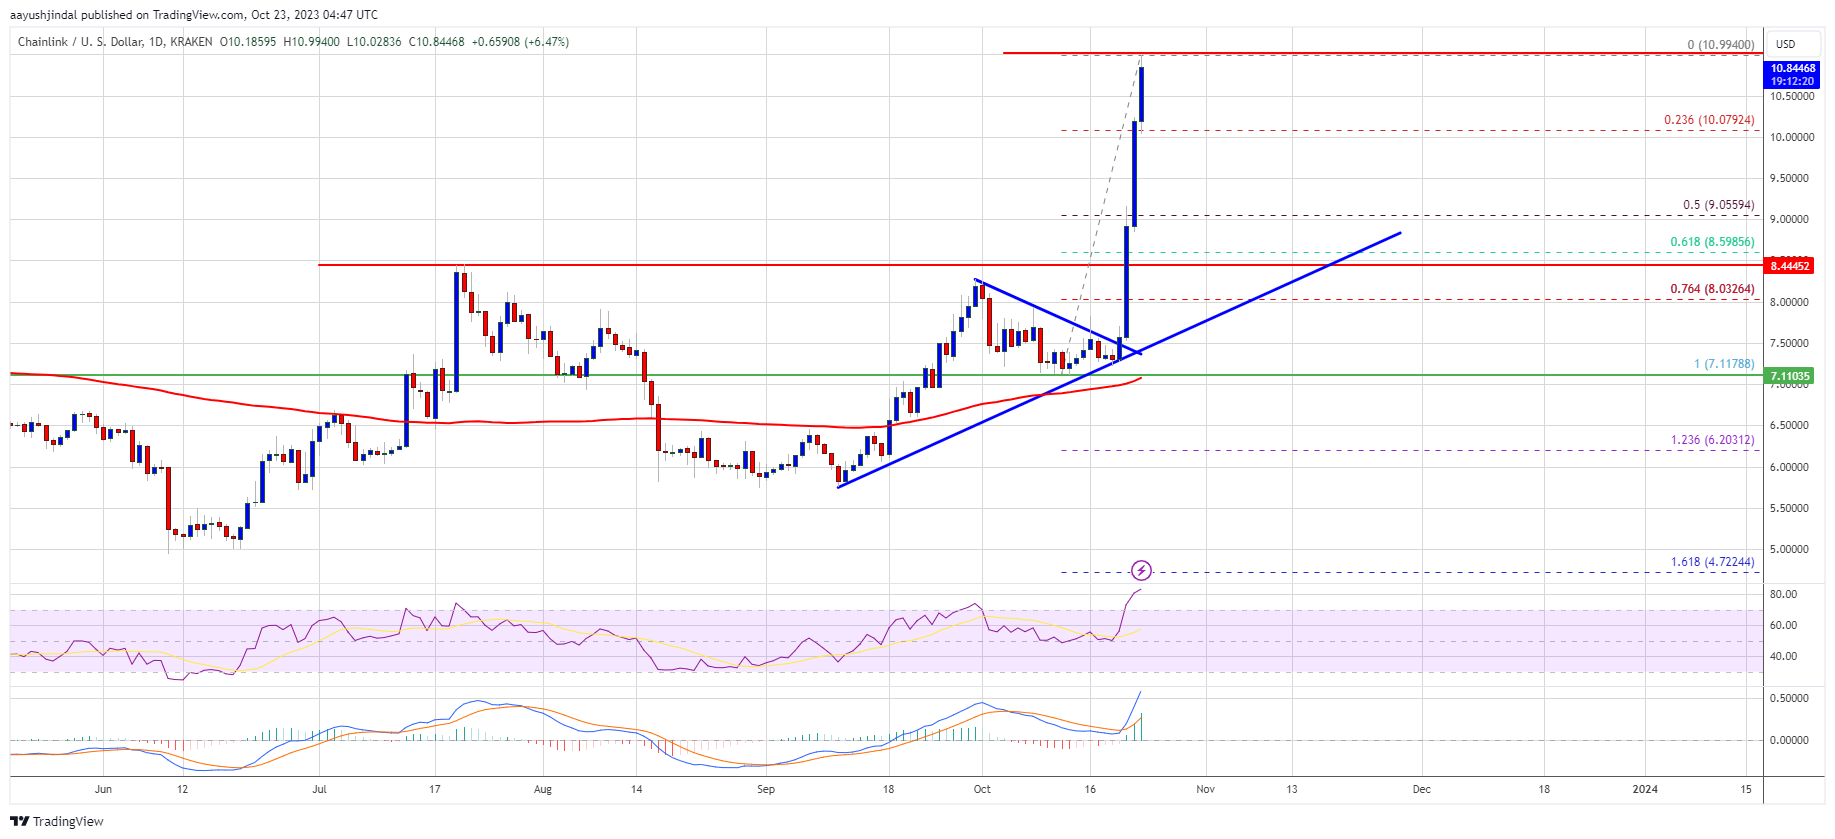
Chainlink’s LINK price is up over 40% and trading above $10. The bulls seem to be in control and might aim a rally toward the $12 resistance.
- Chainlink price is gaining pace above the $10.00 resistance against the US dollar.
- The price is trading above the $10.00 level and the 100-day simple moving average.
- There is a key bullish trend line forming with support near $8.60 on the daily chart of the LINK/USD pair (data source from Kraken).
- The price could continue to move up toward the $11.25 and $12.00 resistance levels.
Chainlink Price Starts Fresh Rally
In the past few days, LINK price started a strong rally against the US Dollar. The price formed a base above the $7.00 level before the bulls stepped in. There was a major pump above the $7.50 and $8.00 resistance levels.
In the last three days, the price gained over 40% and cleared many hurdles near $9.00. The recent pump in Bitcoin also helped LINK surpass the $10.00 resistance. A new multi-week high is formed near $10.99. The price is now consolidating gains well above the 23.6% Fib retracement level of the upward move from the $7.11 swing low to the $10.99 high.
LINK is now trading above the $10.00 level and the 100 simple moving average (4 hours). There is also a key bullish trend line forming with support near $8.60 on the daily chart of the LINK/USD pair. The trend line is near the 61.8% Fib retracement level of the upward move from the $7.11 swing low to the $10.99 high.
Source: LINKUSD on TradingView.com
If there is a fresh increase, the price might face resistance near $11.20. The first major resistance is near the $12.00 zone. A clear break above $12.00 may possibly start a steady increase toward the $12.20 and $12.50 levels. The next major resistance is near the $13.20 level, above which the price could test $15.00.
Are Dips Limited in LINK?
If Chainlink fails to climb above the $11.20 resistance level, there could be a downside correction. Initial support on the downside is near the $10.00 level.
The next major support is near $9.00, below which the price might test the trend line support at $8.60. Any more losses could lead LINK toward the $8.00 level in the near term.
Technical Indicators
4 hours MACD – The MACD for LINK/USD is gaining momentum in the bullish zone.
4 hours RSI (Relative Strength Index) – The RSI for LINK/USD is now above the 50 level.
Major Support Levels – $10.00 and $9.00.
Major Resistance Levels – $11.20 and $12.00.


