
Reason to trust
How Our News is Made
Strict editorial policy that focuses on accuracy, relevance, and impartiality
Ad discliamer
Morbi pretium leo et nisl aliquam mollis. Quisque arcu lorem, ultricies quis pellentesque nec, ullamcorper eu odio.
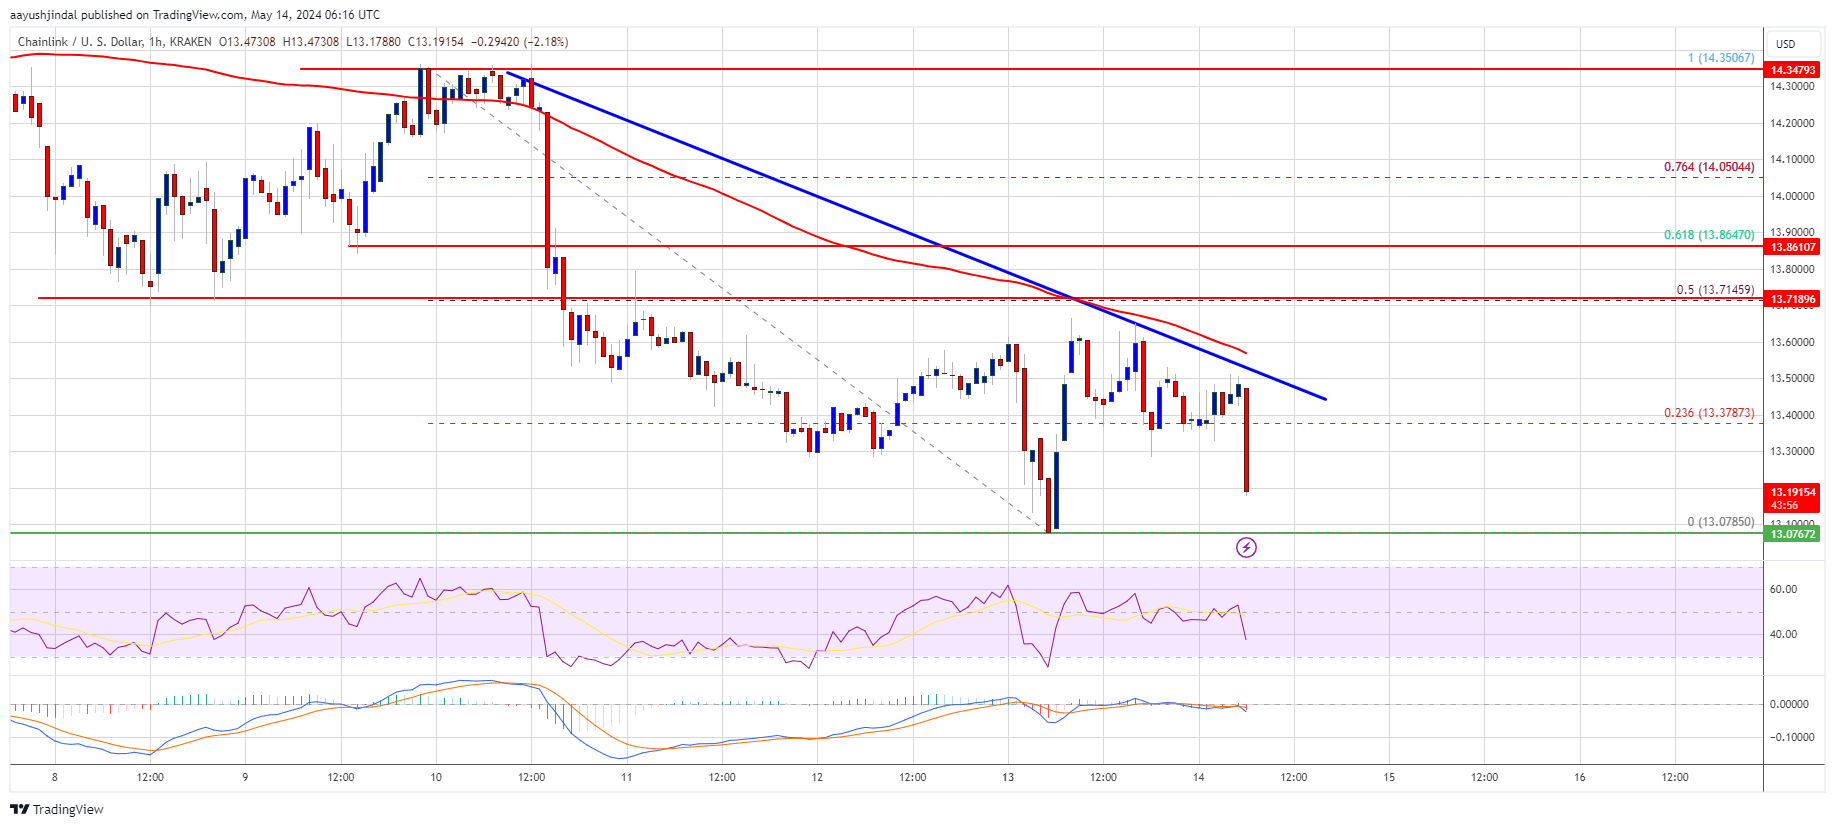
Chainlink’s LINK price is struggling to surpass the $13.80 resistance. The price could continue to move down if it breaks the $13.00 support.
- Chainlink price is showing bearish signs below the $14.00 resistance against the US dollar.
- The price is trading below the $13.60 level and the 100 simple moving average (4 hours).
- There is a key bearish trend line forming with resistance near $13.50 on the 4-hour chart of the LINK/USD pair (data source from Kraken).
- The price could start a decent increase if it clears the $13.80 resistance zone.
Chainlink (LINK) Price Turns Red
In the past few days, Chainlink saw a steady decline from well above the $13.80 level. LINK price declined below the $13.50 support level to enter a short-term bearish zone, like Bitcoin and Ethereum.
The price tested the $13.10 support zone. A low was formed at $13.07 and the price recently attempted a recovery wave. There was a move above the $13.50 level. It even jumped above the 23.6% Fib retracement level of the downward move from the $14.30 swing high to the $13.07 low.
However, the bears were active below the $13.80 resistance and the 50% Fib retracement level of the downward move from the $14.30 swing high to the $13.07 low. LINK price is still trading below the $13.80 level and the 100 simple moving average (4 hours).
Immediate resistance is near the $13.50 level. There is also a key bearish trend line forming with resistance near $13.50 on the 4-hour chart of the LINK/USD pair.
The next major resistance is near the $13.80 zone. A clear break above $13.80 may possibly start a steady increase toward the $14.00 level. The next major resistance is near the $14.35 level, above which the price could test $15.50.
More Losses?
If Chainlink’s price fails to climb above the $13.50 resistance level, there could be a fresh decline. Initial support on the downside is near the $13.10 level.
The next major support is near the $12.80 level, below which the price might test the $12.20 level. Any more losses could lead LINK toward the $11.50 level in the near term.
Technical Indicators
4 hours MACD – The MACD for LINK/USD is gaining momentum in the bearish zone.
4 hours RSI (Relative Strength Index) – The RSI for LINK/USD is now below the 50 level.
Major Support Levels – $13.10 and $12.80.
Major Resistance Levels – $13.50 and $13.80.


