
Reason to trust
How Our News is Made
Strict editorial policy that focuses on accuracy, relevance, and impartiality
Ad discliamer
Morbi pretium leo et nisl aliquam mollis. Quisque arcu lorem, ultricies quis pellentesque nec, ullamcorper eu odio.
Chainlink (LINK) traded to a new yearly high near $27.00 before correcting lower, similar to bitcoin and Ethereum. The price is now holding a major support at $24.00 and the 100 SMA (H4).
- Chainlink token price started a downside correction from the $27.03 high against the US dollar.
- The price is well bid above the $24.00 level and the 100 simple moving average (4-hours).
- There is a key bullish trend line forming with support near $23.85 on the 4-hours chart of the LINK/USD pair (data source from Kraken).
- The price is showing positive signs and it could start a fresh increase towards the $27.00 level.
Chainlink (LINK) Remains Well Supported
After a close above $25.00, chainlink (LINK) extended its upward move against the US Dollar, similar to bitcoin and Ethereum. There was a clear break above the $26.50 level and the price traded to a new high at $27.03.
The price started a downside correction from $27.03 and traded below the $26.00 level. There was a break below the $25.50 support level. The price even spiked below the $24.00 level and traded as low as $22.92.
However, the price remained well supported and it recovered above $23.50. LINK price is now trading nicely above the $24.00 level and the 100 simple moving average (4-hours). It already tested the 50% Fib retracement level of the recent decline from the $27.03 high to $22.92 low.
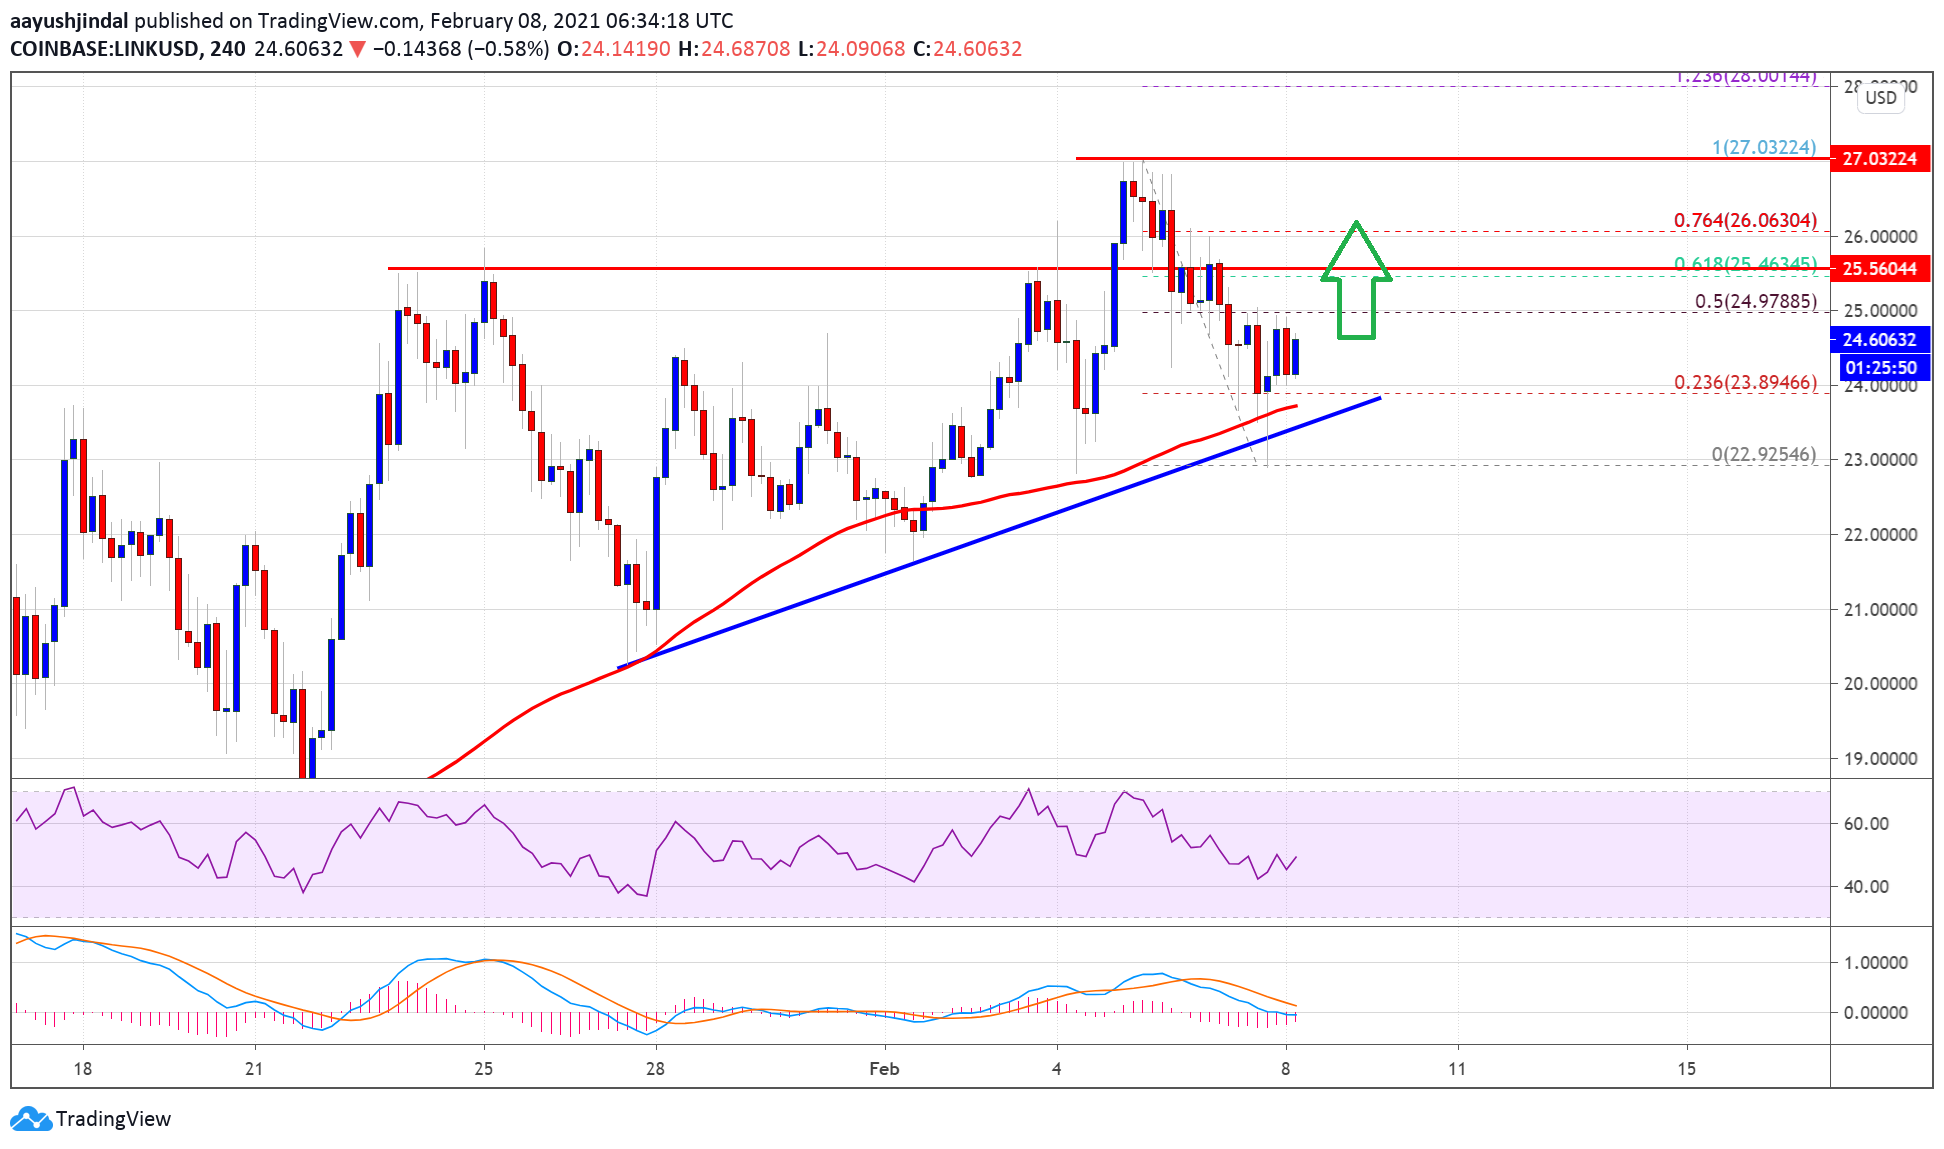
Source: LINKUSD on TradingView.com
There is also a key bullish trend line forming with support near $23.85 on the 4-hours chart of the LINK/USD pair. On the upside, the price is facing resistance near the $25.00 level.
The next major resistance is near the $25.50 level. It is close to the 61.8% Fib retracement level of the recent decline from the $27.03 high to $22.92 low. A clear break above $25.50 may possibly start a fresh increase towards the $27.00 and $28.00 levels.
More Losses?
If chainlink’s price fails to climb above the $25.00 level, there could be a fresh decline. An initial support on the downside is near the $24.00 level and the trend line.
A break below the trend line support might push the price further lower towards $23.00. Any more losses could lead the price towards the $22.00 level.
Technical Indicators
4-hours MACD – The MACD for LINK/USD is gaining momentum in the bullish zone.
4-hours RSI (Relative Strength Index) – The RSI for LINK/USD is currently close to the 50 level.
Major Support Levels – $24.00, $23.85 and $22.00.
Major Resistance Levels – $25.00, $25.50 and $27.00.


