
Reason to trust
How Our News is Made
Strict editorial policy that focuses on accuracy, relevance, and impartiality
Ad discliamer
Morbi pretium leo et nisl aliquam mollis. Quisque arcu lorem, ultricies quis pellentesque nec, ullamcorper eu odio.
Chainlink (LINK) rallied more than 40% and traded to a new all-time high at $8.530 against the US Dollar. It is currently correcting lower, but dips are likely to find support near $7.200.
- Chainlink token price extended its rally above the $7.500 and $8.000 resistance levels against the US dollar.
- The price traded to a new all-time high at $8.530 and it is currently correcting lower.
- There is a major bullish trend line forming with support at $7.000 on the 4-hours chart of the LINK/USD pair (data source from Kraken).
- The pair is likely to extend its rise towards the $10.00 level as long as it is above the $7.000 support.
Chainlink (LINK) Rallies 40%
In the last technical analysis of chainlink (LINK), we discussed why there could be more upsides above $6.500 and $7.000 against the US Dollar. LINK did break the $7.000 resistance and extended its rally by more than 40%.
It even surged above the $8.000 resistance and settled well above the 100 simple moving average (4-hours). A new all-time high is formed near $8.530 and the price is currently correcting lower, while major cryptocurrencies (bitcoin and Ethereum) are struggling to clear key hurdles.
LINK is currently correcting lower below the $8.200 level. An initial support is near the $7.880 level or the 23.6% Fib retracement level of the recent rally from the $5.729 low to $8.530 high.
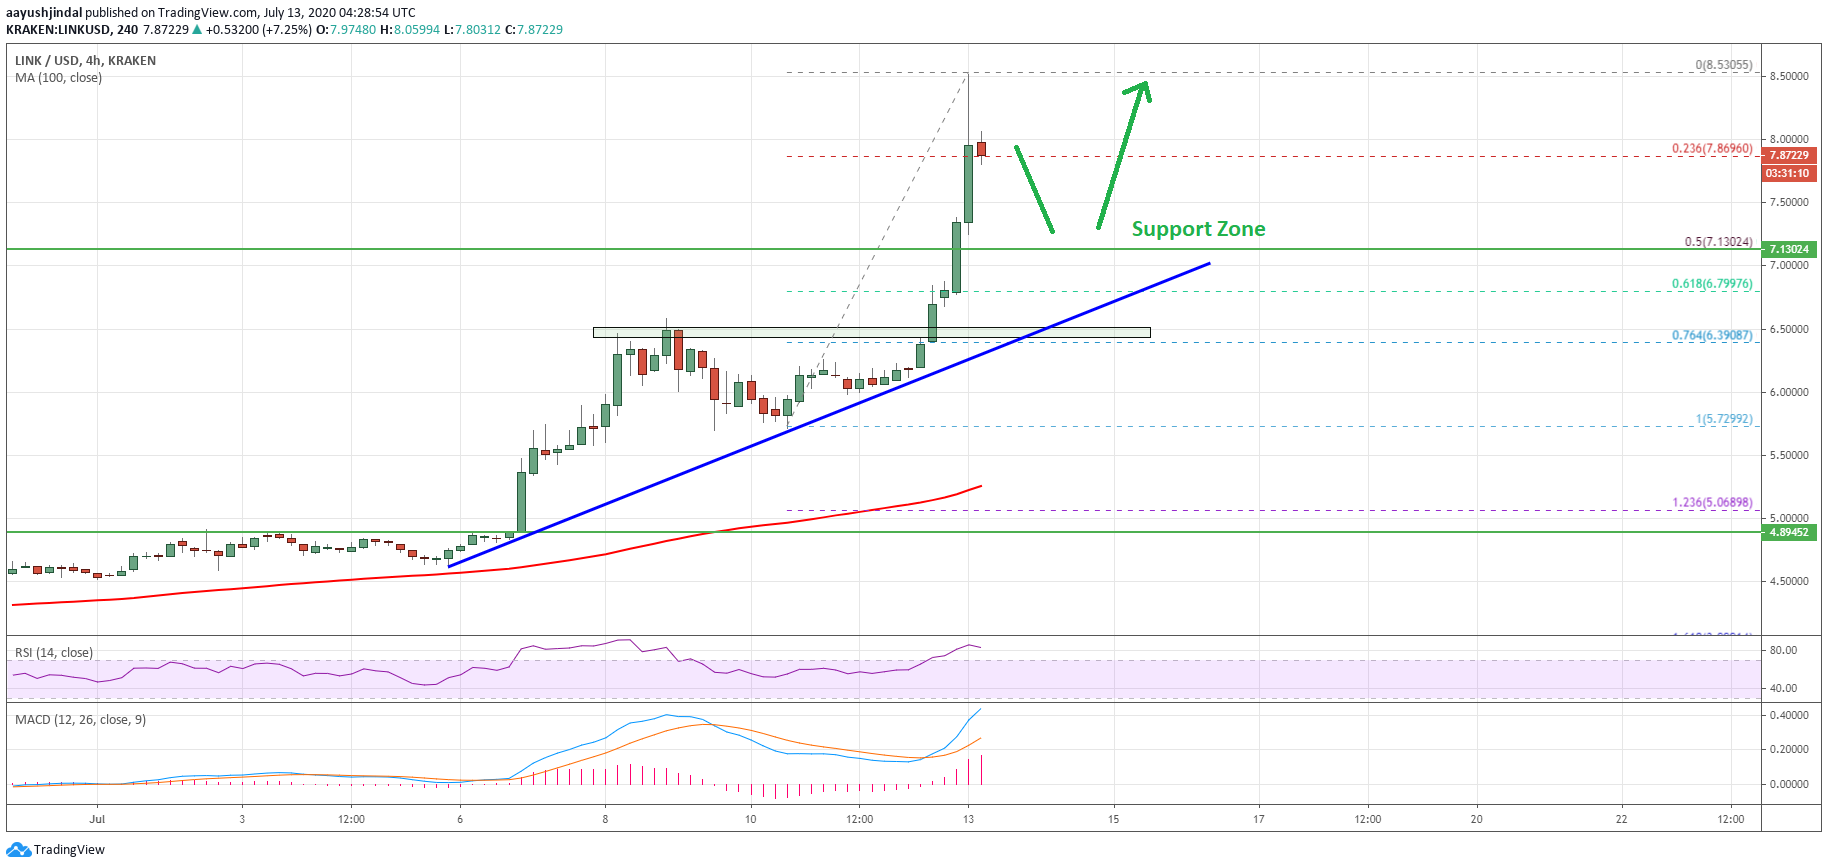
LINK price above $8.000. Source: TradingView.com
The first major support on the downside is near the $7.200 and $7.150 levels. It is close to the 50% Fib retracement level of the recent rally from the $5.729 low to $8.530 high. More importantly, there is a major bullish trend line forming with support at $7.000 on the 4-hours chart of the LINK/USD pair.
If chainlink token price stays above the $7.200 and $7.000 support levels, it could start a fresh increase. An initial resistance is near the $8.200 and $8.500 levels. A clear break above the $8.500 level might open the doors for a push towards the $10.00 barrier in the coming days.
Dips Remain Supported
If LINK price corrects lower, the bulls are likely to protect the $7.200 and $7.000 support levels. A successful close below the $7.000 support might push the price into a major correction phase.
In the mentioned case, the price could revisit the $6.400 support level (the recent breakout zone). Any further losses may perhaps start a bearish wave towards the $5.000 level.
Technical Indicators
4-hours MACD – The MACD for LINK/USD is gaining momentum in the bullish zone.
4-hours RSI (Relative Strength Index) – The RSI for LINK/USD is currently well into the overbought zone.
Major Support Levels – $7.880, $7.200 and $7.000.
Major Resistance Levels – $8.200, $8.500 and $10.00.
Take advantage of the trading opportunities with Plus500
Risk disclaimer: 76.4% of retail CFD accounts lose money.


