
Reason to trust
How Our News is Made
Strict editorial policy that focuses on accuracy, relevance, and impartiality
Ad discliamer
Morbi pretium leo et nisl aliquam mollis. Quisque arcu lorem, ultricies quis pellentesque nec, ullamcorper eu odio.
BNB price (Binance coin) failed to settle above $225 and trimmed gains against the US Dollar. The price could decline heavily if it trades below $210.
- Binance coin price tested the $235 resistance before the bears appeared against the US Dollar.
- The price is now trading below $220 and the 100 simple moving average (4 hours).
- There was a break below a key bullish trend line with support near $220 on the 4-hour chart of the BNB/USD pair (data source from Binance).
- The pair might gain continue to move down unless there is a close above $225.
Binance Coin Price Fails Again
In the last analysis, we discussed the chances of BNB price recovering toward the $235 resistance zone. The price did climb higher toward the $235 resistance but failed to extend gains.
It started a fresh decline from the $235 zone. There was a break below a key bullish trend line with support near $220 on the 4-hour chart of the BNB/USD pair. The pair is now showing bearish signs below $220 and the 100 simple moving average (4 hours), like Bitcoin and Ethereum.
A low is formed near $211.1 and the price is now consolidating losses. On the upside, it is facing resistance near the $216.5 level and the 100 simple moving average (4 hours). It is close to the 23.6% Fib retracement level of the recent decline from the $235 swing high to the $211 low.
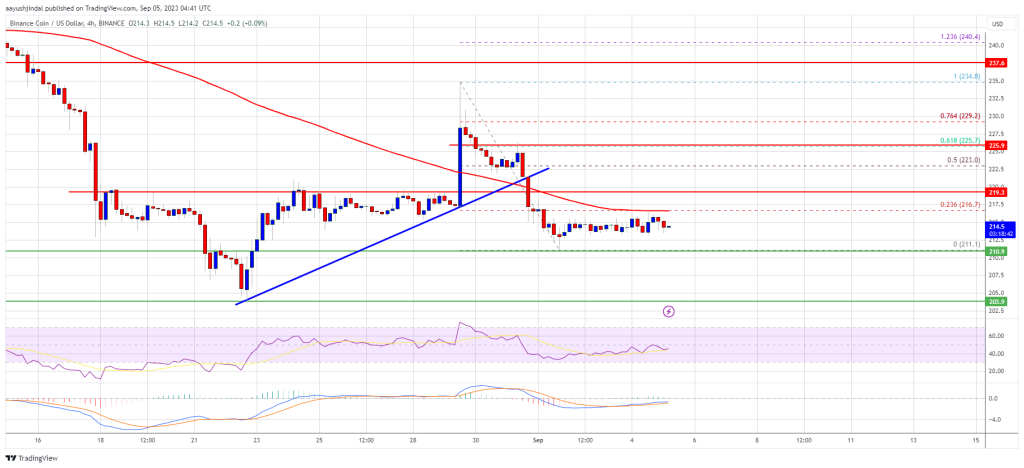
Source: BNBUSD on TradingView.com
A clear move above the $217 zone could send the price further higher. The next major resistance is near $225 or the 61.8% Fib retracement level of the recent decline from the $235 swing high to the $211 low, above which the price might rise toward $235. A close above the $235 resistance might set the pace for a larger increase toward the $250 resistance.
Another Decline in BNB?
If BNB fails to clear the $217 resistance, it could start another decline. Initial support on the downside is near the $211 level.
The next major support is near the $210 level. If there is a downside break below the $210 support, the price could drop toward the $202 support. Any more losses could send the price toward the $184 support.
Technical Indicators
4-Hours MACD – The MACD for BNB/USD is losing pace in the bearish zone.
4-Hours RSI (Relative Strength Index) – The RSI for BNB/USD is currently below the 50 level.
Major Support Levels – $211, $210, and $202.
Major Resistance Levels – $217, $225, and $235.


