
Reason to trust
How Our News is Made
Strict editorial policy that focuses on accuracy, relevance, and impartiality
Ad discliamer
Morbi pretium leo et nisl aliquam mollis. Quisque arcu lorem, ultricies quis pellentesque nec, ullamcorper eu odio.
BNB price (Binance coin) is showing positive signs above the $320 level against the US Dollar. It could continue to move up if there is a break above the $340 resistance.
- Binance coin price is showing bullish signs above the $320 level against the US Dollar.
- The price is now trading above $315 and the 100 simple moving average (4-hours).
- There is a key contracting triangle forming with resistance near $330 on the 4-hours chart of the BNB/USD pair (data source from Binance).
- The pair could accelerate gains if there is a clear move above the $340 resistance.
Binance Coin Price Eyes More Gains
In the past few days, BNB price saw a decent increase above the $300 resistance, similar to bitcoin and ethereum. There was a clear move above the $320 and $335 resistance levels.
However, the bulls failed to clear the $350 resistance zone. A high was formed near $347 and the price recently started a downside correction. There was a move below the $335 and $330 levels. The price declined below the 50% Fib retracement level of the upward move from the $300 swing low to $347 high.
However, BNB price is still trading above $315 and the 100 simple moving average (4-hours). It stayed above the 61.8% Fib retracement level of the upward move from the $300 swing low to $347 high.
On the upside, an immediate resistance is near the $330 zone. There is also a key contracting triangle forming with resistance near $330 on the 4-hours chart of the BNB/USD pair. The next major resistance is near the $335 level. The main resistance is forming near the $340 zone.
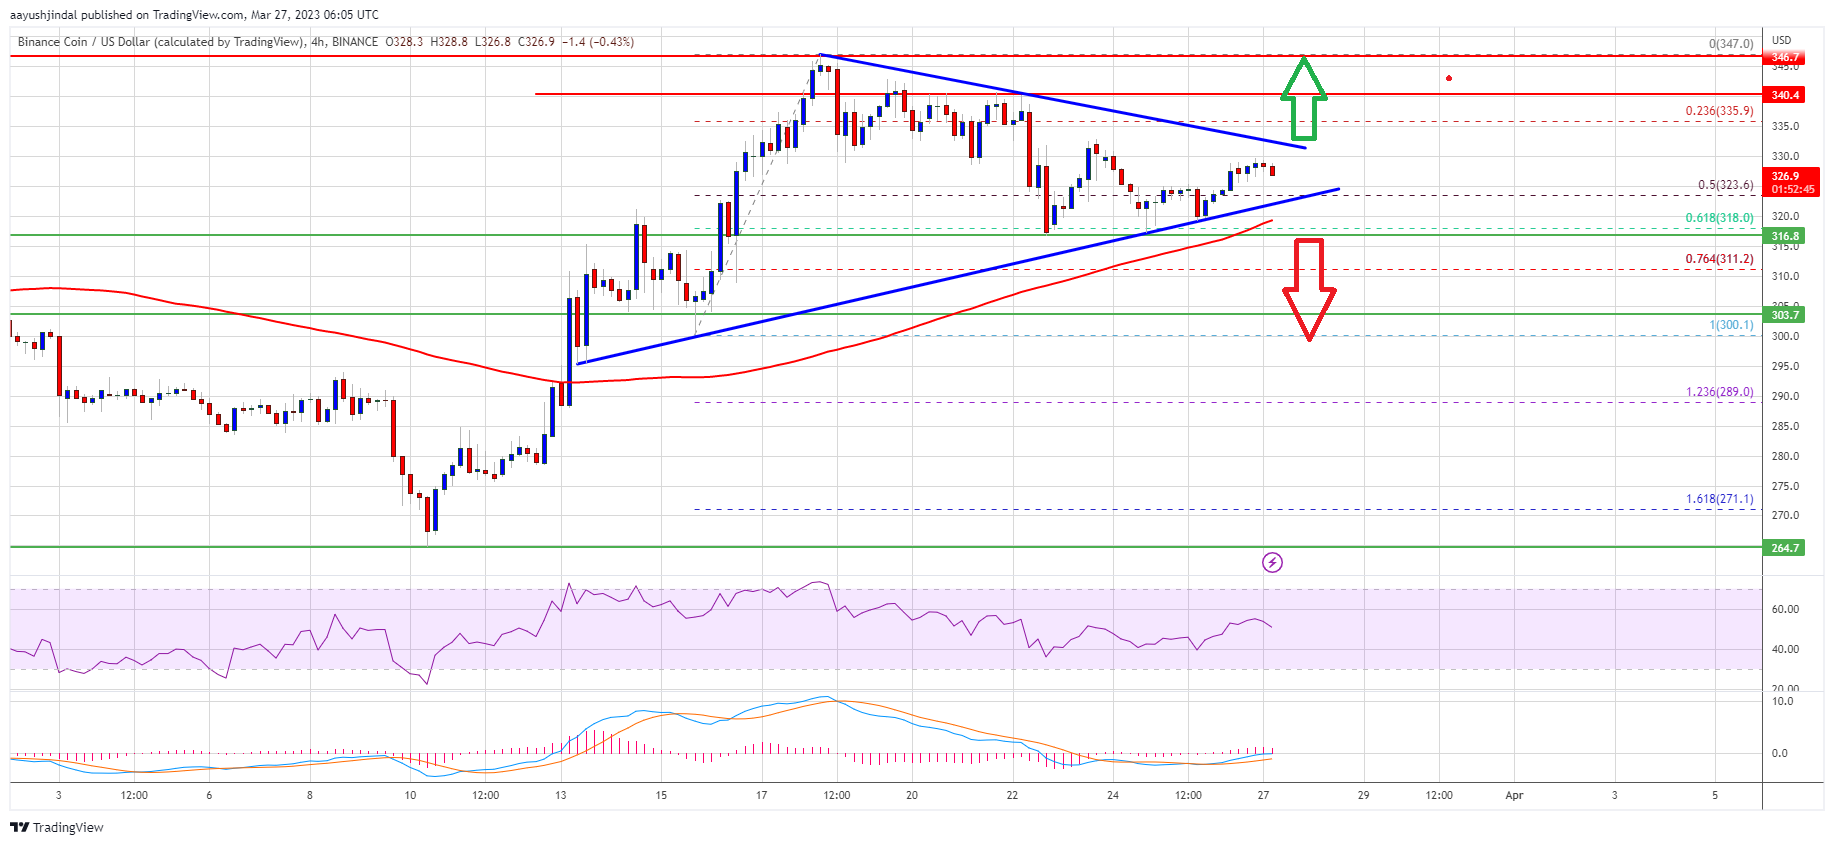
Source: BNBUSD on TradingView.com
A clear move above the triangle resistance and then $340 might send the price towards the $365 resistance. Any more gains might send the price towards the $400 level.
Downside Break in BNB?
If BNB fails to clear the $340 resistance, it could start another decline. An initial support on the downside is near the $322 level.
The first major support is near the $315 level or the 100 simple moving average (4-hours). The next major support is near the $300 level. If there is a downside break below the $300 support, there could be an extended decline towards the $280 support.
Technical Indicators
4-Hours MACD – The MACD for BNB/USD is gaining pace in the bullish zone.
4-Hours RSI (Relative Strength Index) – The RSI for BNB/USD is currently above the 50 level.
Major Support Levels – $322, $315 and $300.
Major Resistance Levels – $330, $340 and $365.


