
Reason to trust
How Our News is Made
Strict editorial policy that focuses on accuracy, relevance, and impartiality
Ad discliamer
Morbi pretium leo et nisl aliquam mollis. Quisque arcu lorem, ultricies quis pellentesque nec, ullamcorper eu odio.
BNB price (Binance coin) is recovering above $240 against the US Dollar. The price might gain bullish momentum if it clears $250 and $255.
- Binance coin price is attempting a recovery wave above $232 against the US Dollar.
- The price is now trading below $240 and the 100 simple moving average (4 hours).
- There was a break above a major bearish trend line with resistance near $235 on the 4-hour chart of the BNB/USD pair (data source from Binance).
- The pair might gain bullish momentum above $250 and $255.
Binance Coin Price Starts Increase
In the past few days, BNB price saw a major decline below the $250 support. There was a move below the $240 support zone. The price traded as low as $224 and is currently rising, similar to Bitcoin and Ethereum.
There was a move above the $232 resistance. The price climbed above the 50% Fib retracement level of the main drop from the $257 swing high to the $224 low. There was also a break above a major bearish trend line with resistance near $235 on the 4-hour chart of the BNB/USD pair.
BNB price is now trading below $240 and the 100 simple moving average (4 hours). On the upside, it is facing resistance near the $250 level. It is close to the 76.4% Fib retracement level of the main drop from the $257 swing high to the $224 low.
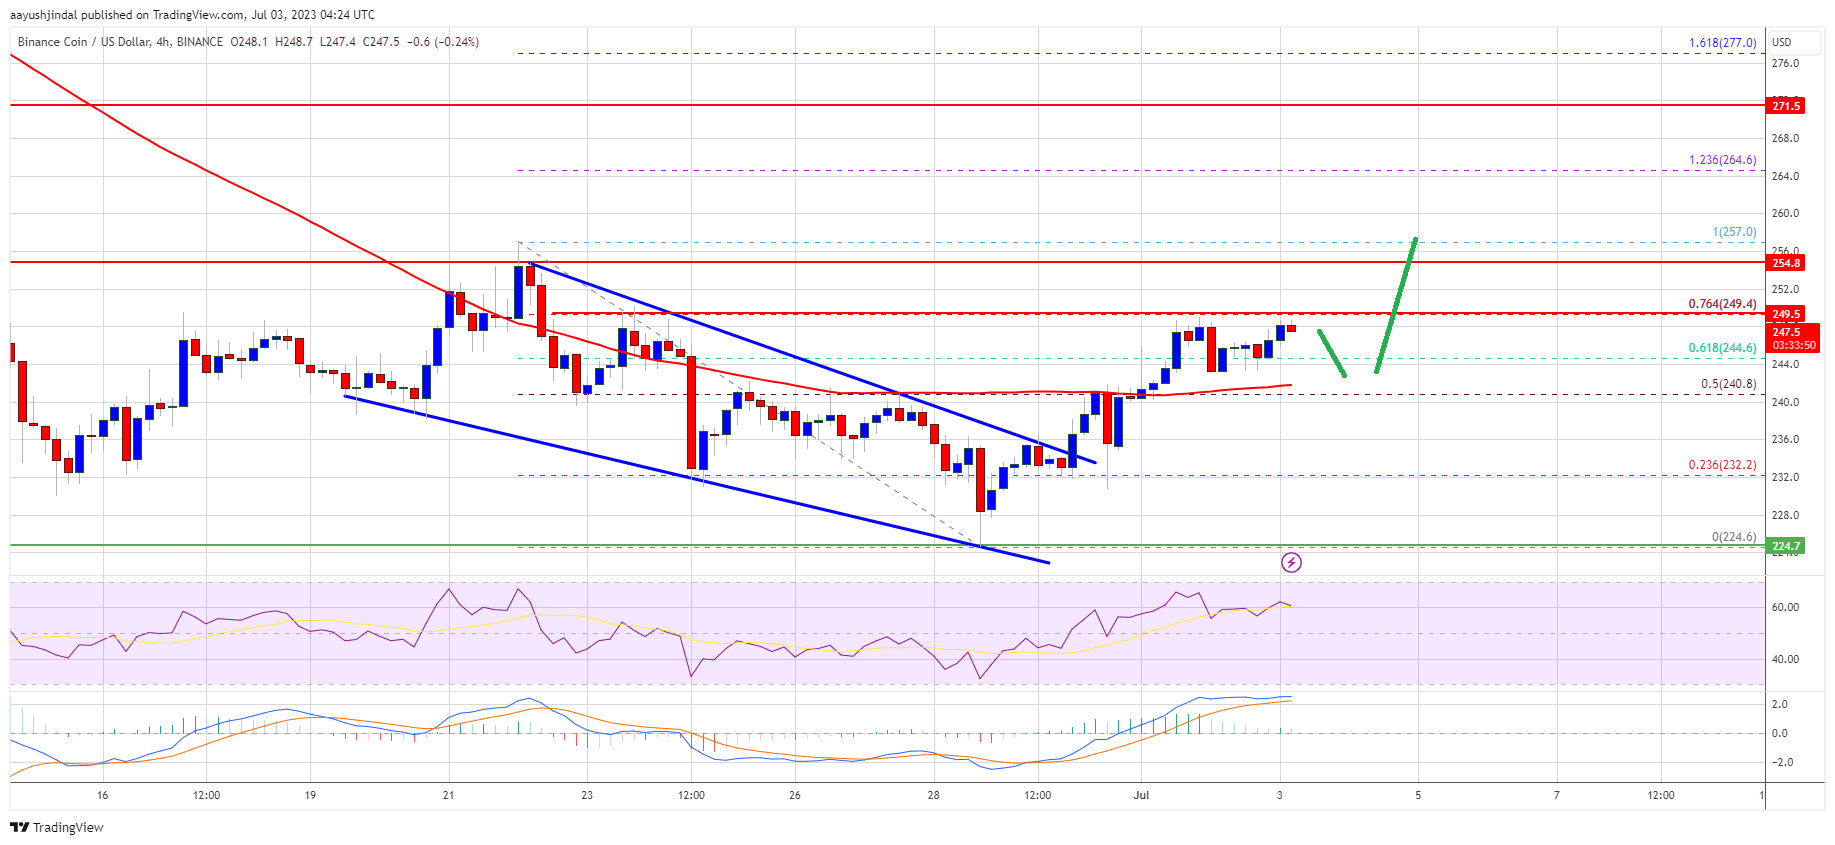
Source: BNBUSD on TradingView.com
The next major resistance is near $255. A clear move above the $250 resistance and $255 might start a steady increase. The next major resistance is near the $270 level, above which the price might rise toward the $285 resistance.
Fresh Decline in BNB?
If BNB fails to clear the $250 resistance, it could start another decline. Initial support on the downside is near the $240 level and the 100 simple moving average (4 hours).
The next major support is near the $232 level. If there is a downside break below the $232 support, the price could revisit the $225 support. Any more losses could send the price toward the $210 support.
Technical Indicators
4-Hours MACD – The MACD for BNB/USD is losing pace in the bullish zone.
4-Hours RSI (Relative Strength Index) – The RSI for BNB/USD is currently above the 50 level.
Major Support Levels – $240, $232, and $225.
Major Resistance Levels – $250, $255, and $270.


