
Reason to trust
How Our News is Made
Strict editorial policy that focuses on accuracy, relevance, and impartiality
Ad discliamer
Morbi pretium leo et nisl aliquam mollis. Quisque arcu lorem, ultricies quis pellentesque nec, ullamcorper eu odio.
BNB price (Binance coin) found support near $255 against the US Dollar. BNB is rising and might gain pace if it clears the $285 resistance zone.
- Binance coin price started a recovery wave from the $255 support against the US Dollar.
- The price is now trading below $280 and the 100 simple moving average (4-hours).
- There is a major bearish trend line forming with resistance near $285 on the 4-hours chart of the BNB/USD pair (data source from Binance).
- The pair could start a fresh rally if it clears the $285 and $290 levels.
Binance Coin Price Aims Upside Break
After a steady decline, BNB price settled below the $280 level. It tested the $255 support zone and traded as low as $253.8. Recently, there was a recovery wave above the $260 level, similar to bitcoin and ethereum.
The price climbed above the $265 and $268 resistance levels. There was a clear move above the 23.6% Fib retracement level of the main decline from the $317 swing high to $253 swing low. However, bnb price is still trading below $280 and the 100 simple moving average (4-hours).
On the upside, the $280 and $285 levels are immediate hurdles. There is also a major bearish trend line forming with resistance near $285 on the 4-hours chart of the BNB/USD pair.
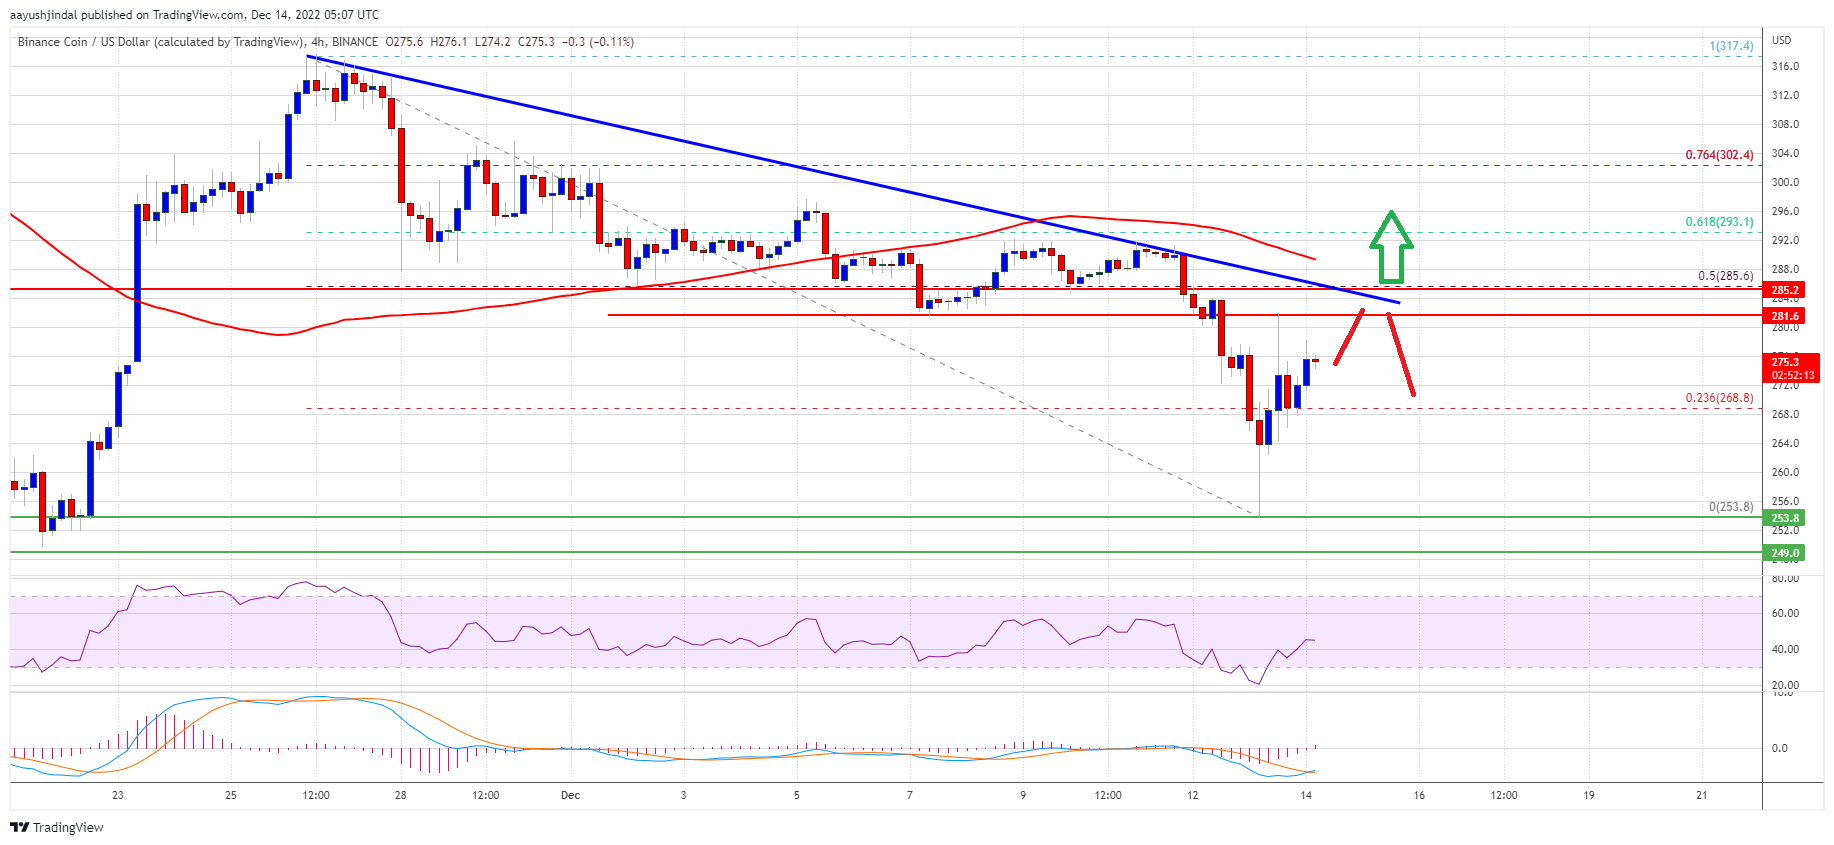
Source: BNBUSD on TradingView.com
The 50% Fib retracement level of the main decline from the $317 swing high to $253 swing low is also near $285. The next major resistance is near the $290 level, above which the price is likely to aim a test of the $320 level in the near term. Any more gains might send the price towards the $350 level.
Fresh Decline in BNB?
If BNB fails to clear the $285 resistance, it could start a fresh decline. An initial support on the downside is near the $268 and $265 levels.
The first major support is near the $260 level. The next major support is near the $255 level. If there is a downside break below the $255 support, there could be an extended decline towards the $225 support.
Technical Indicators
4-Hours MACD – The MACD for BNB/USD is gaining pace in the bullish zone.
4-Hours RSI (Relative Strength Index) – The RSI for BNB/USD is currently near the 50 level.
Major Support Levels – $265, $260 and $255.
Major Resistance Levels – $285, $290 and $320.


