
Reason to trust
How Our News is Made
Strict editorial policy that focuses on accuracy, relevance, and impartiality
Ad discliamer
Morbi pretium leo et nisl aliquam mollis. Quisque arcu lorem, ultricies quis pellentesque nec, ullamcorper eu odio.
BNB price (Binance coin) found support near $300 against the US Dollar. BNB rallied above $320 and might aim more upsides towards the $400 level.
- Binance coin price started a steady increase from the $300 support against the US Dollar.
- The price is now trading above $320 and the 100 simple moving average (4-hours).
- There was a break above a major contracting triangle with resistance near $320 on the 4-hours chart of the BNB/USD pair (data source from Binance).
- The pair could is rising and might climb further above the $335 resistance zone.
Binance Coin Price Rallies Over 5%
This past week, BNB price formed a support base above the $300 level. The bulls were active and they were able to pump the price above the $310 and $312 resistance levels.
The price is up over 5% in a day and there was a move above the $320 resistance. Besides, there was a break above a major contracting triangle with resistance near $320 on the 4-hours chart of the BNB/USD pair. The pair is now showing positive signs, similar to bitcoin and ethereum.
BNB traded as high as $332 and is currently consolidating gains. It is now trading above $320 and the 100 simple moving average (4-hours). It is also well above the 23.6% Fib retracement level of the upward move from the $301 swing low to $332 high.
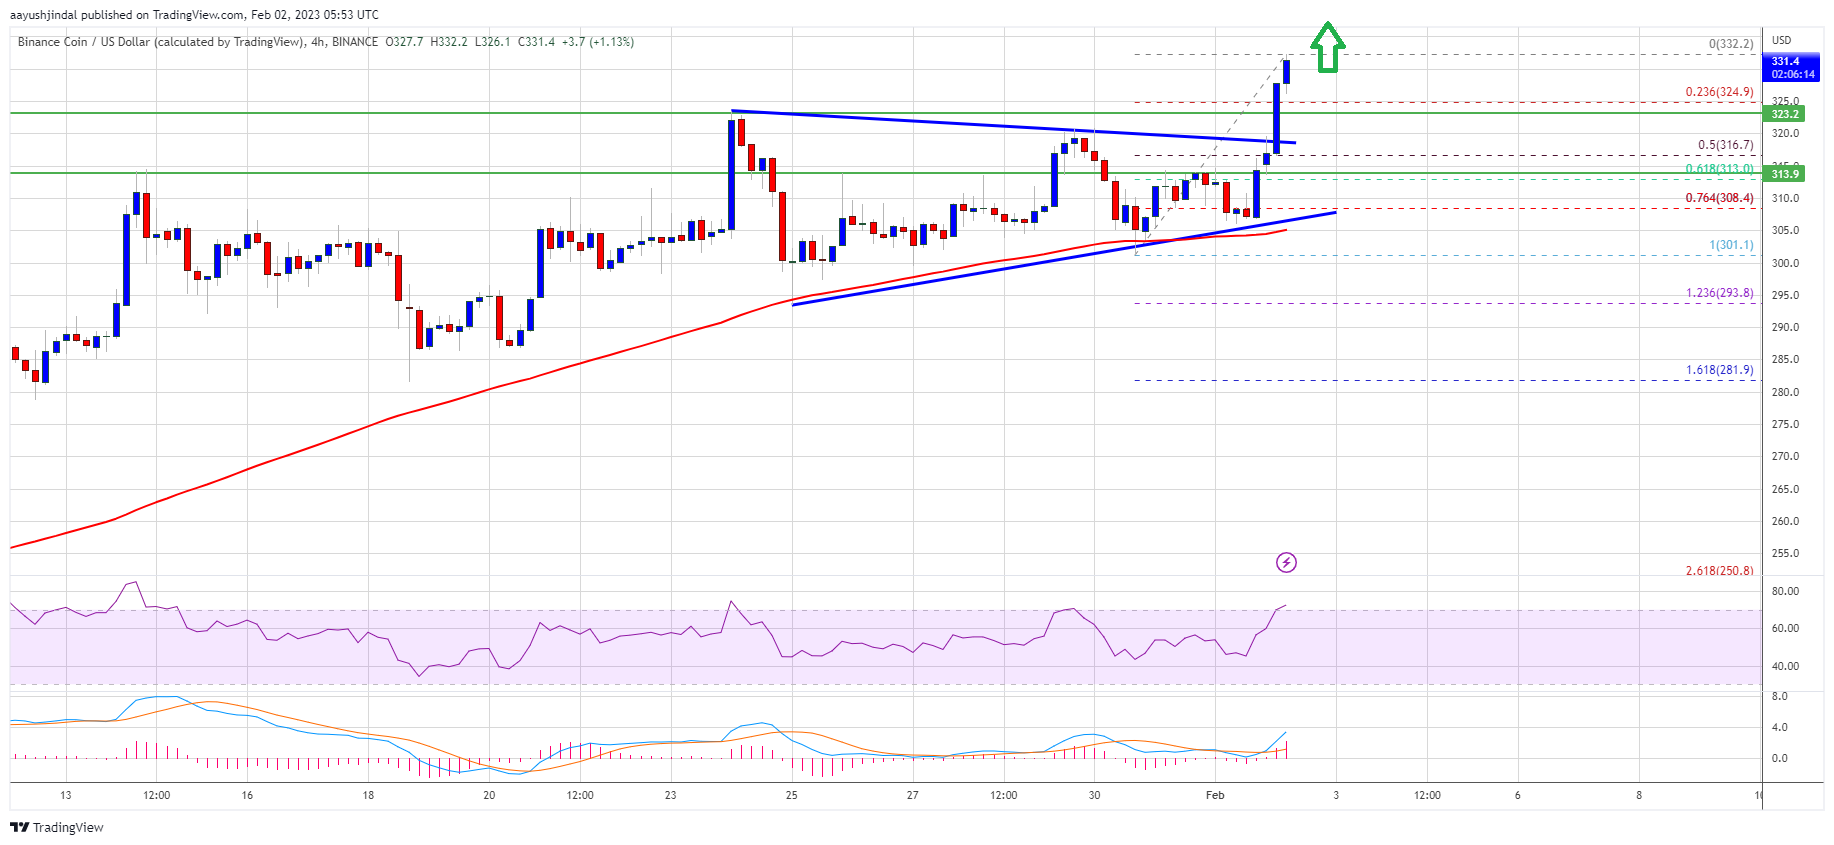
Source: BNBUSD on TradingView.com
On the upside, the bears are protecting the $332 and $332 resistance levels. The next major resistance is near the $350 level, above which the price is likely to aim a test of the $400 level in the near term. Any more gains might send the price towards the $420 level.
Dips Supported in BNB?
If BNB fails to clear the $335 resistance, it could start a downside correction. An initial support on the downside is near the $325 level.
The first major support is near the $315 level. It is near the 50% Fib retracement level of the upward move from the $301 swing low to $332 high. The next major support is near the $308 level. If there is a downside break below the $308 support, there could be an extended decline towards the $300 support.
Technical Indicators
4-Hours MACD – The MACD for BNB/USD is gaining pace in the bullish zone.
4-Hours RSI (Relative Strength Index) – The RSI for BNB/USD is currently above the 50 level.
Major Support Levels – $325, $315 and $308.
Major Resistance Levels – $335, $350 and $400.


