
Reason to trust
How Our News is Made
Strict editorial policy that focuses on accuracy, relevance, and impartiality
Ad discliamer
Morbi pretium leo et nisl aliquam mollis. Quisque arcu lorem, ultricies quis pellentesque nec, ullamcorper eu odio.
BNB price (Binance coin) is moving lower below $290 against the US Dollar. It could continue to move down if there is a drop below $270.
- Binance coin price is showing bearish signs below the $300 level against the US Dollar.
- The price is now trading below $285 and the 100 simple moving average (4-hours).
- There is a key bearish trend line forming with resistance near $288 on the 4-hours chart of the BNB/USD pair (data source from Binance).
- The pair could resume its decline if there is no clear move above $288.
Binance Coin Price Declines Over 5%
In the past few days, BNB price saw a steady decline from the $325 resistance zone. The price dropped below the $310 and $300 levels. The decline gained pace below the $285 support.
Today, it is down over 5% but less compared to bitcoin and ethereum. There was a spike below the $275 level and a low is formed near $271. The price is now consolidating losses below the $285 zone and the 100 simple moving average (4-hours).
On the upside, an immediate resistance is near the $276 level. It is near the 23.6% Fib retracement level of the recent decline from the $293 swing high to $271 low.
The next major resistance is near the $282 level. It is near the 50% Fib retracement level of the recent decline from the $293 swing high to $271 low. The main resistance is forming near the $285 zone. There is also a key bearish trend line forming with resistance near $288 on the 4-hours chart of the BNB/USD pair.
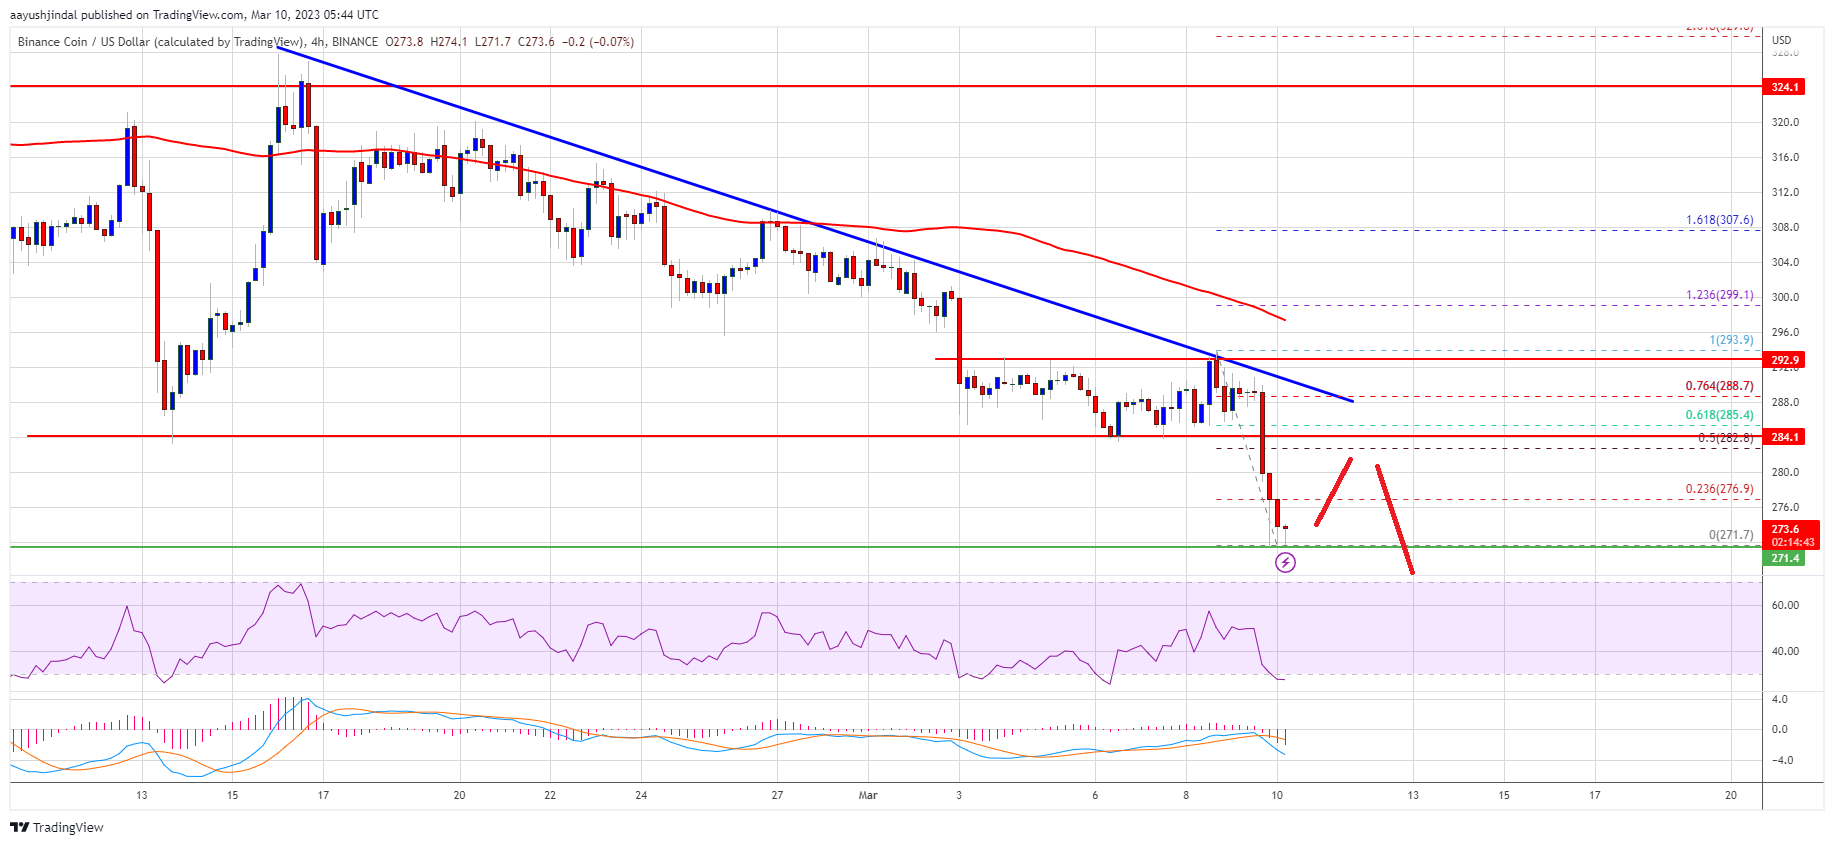
Source: BNBUSD on TradingView.com
A clear move above the trend line and then $290 might send the price towards the $300 resistance. Any more gains might send the price towards the $320 level.
More Losses in BNB?
If BNB fails to clear the $285 resistance, it could continue to move down. An initial support on the downside is near the $272 level.
The first major support is near the $265 level. The next major support is near the $262 level. If there is a downside break below the $262 support, there could be an extended decline towards the $250 support.
Technical Indicators
4-Hours MACD – The MACD for BNB/USD is gaining pace in the bearish zone.
4-Hours RSI (Relative Strength Index) – The RSI for BNB/USD is currently below the 40 level.
Major Support Levels – $272, $262 and $250.
Major Resistance Levels – $285, $288 and $290.


