
Reason to trust
How Our News is Made
Strict editorial policy that focuses on accuracy, relevance, and impartiality
Ad discliamer
Morbi pretium leo et nisl aliquam mollis. Quisque arcu lorem, ultricies quis pellentesque nec, ullamcorper eu odio.
BNB price (Binance coin) started a strong decline against the US Dollar after BUSD’s crackdown. BNB traded below $300 and is now showing bearish signs.
- Binance coin price started a fresh decline below the $300 support against the US Dollar.
- The price is now trading below $320 and the 100 simple moving average (4-hours).
- There is a key bearish trend line forming with resistance near $305 on the 4-hours chart of the BNB/USD pair (data source from Binance).
- The pair could correct higher, but upsides might be limited above the $305 and $310 levels.
Binance Coin Price Drops Over 10%
This week, BNB price saw a strong bearish reaction from the $320 resistance zone. The New York Department of Financial Services ordered Paxos Trust Co. to stop creating more of its BUSD token.
It sparked a bearish wave in BNB and the price declined below the $300 support zone (also sparking bearish moves in bitcoin and ethereum). The price even spiked below the $285 support zone. A low is formed near $283 and the price is now consolidating losses. It is trading below $320 and the 100 simple moving average (4-hours).
On the upside, an immediate resistance is near the $292 zone. It is near the 23.6% Fib retracement level of the downward move from the $321 swing high to $283 low.
The next major resistance is near the $300 level. There is also a key bearish trend line forming with resistance near $305 on the 4-hours chart of the BNB/USD pair. The trend line is near the 50% Fib retracement level of the downward move from the $321 swing high to $283 low.
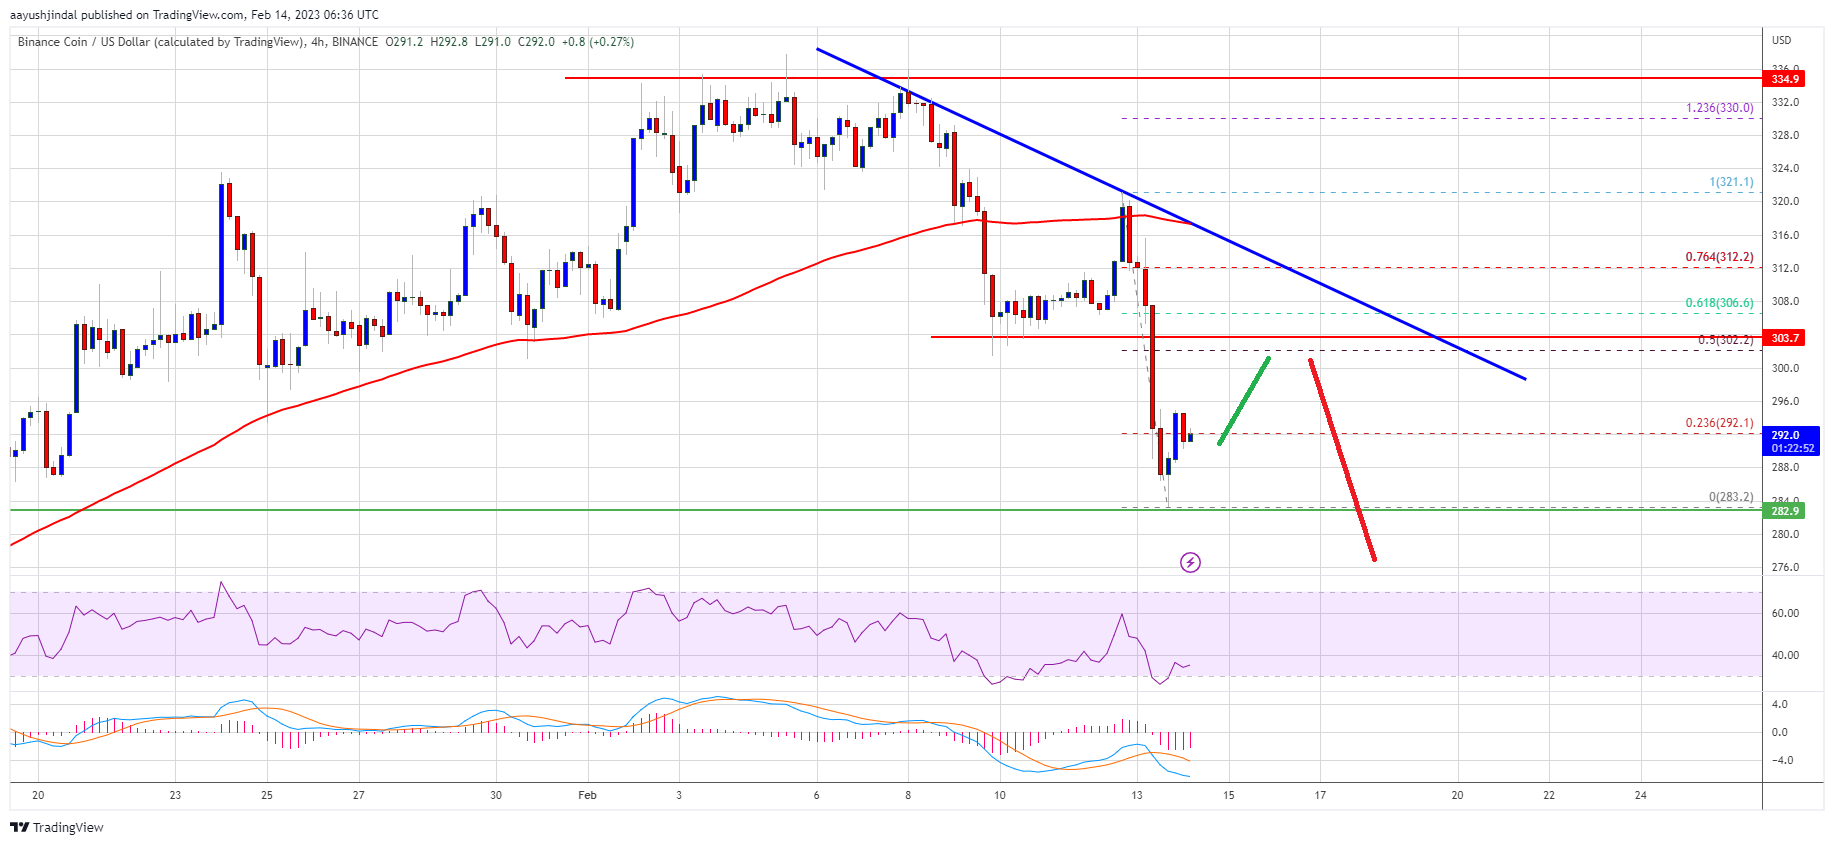
Source: BNBUSD on TradingView.com
A clear move above the trend line might send the price towards the $320 resistance. Any more gains might send the price towards the $335 level.
More Losses in BNB?
If BNB fails to clear the $300 resistance, it could continue to move down. An initial support on the downside is near the $285 level.
The first major support is near the $282 level. The next major support is near the $275 level. If there is a downside break below the $275 support, there could be an extended decline towards the $250 support.
Technical Indicators
4-Hours MACD – The MACD for BNB/USD is losing pace in the bearish zone.
4-Hours RSI (Relative Strength Index) – The RSI for BNB/USD is currently below the 50 level.
Major Support Levels – $285, $282 and $265.
Major Resistance Levels – $300, $305 and $320.


