
Reason to trust
How Our News is Made
Strict editorial policy that focuses on accuracy, relevance, and impartiality
Ad discliamer
Morbi pretium leo et nisl aliquam mollis. Quisque arcu lorem, ultricies quis pellentesque nec, ullamcorper eu odio.
BNB price (Binance coin) is consolidating below $250 against the US Dollar. The price could start a strong increase if it clears the $245 and $250 resistance levels.
- Binance coin price is struggling to gain pace above the $250 zone against the US Dollar.
- The price is now trading below $245 and the 100 simple moving average (4 hours).
- There was a break above a key bearish trend line with resistance near $240 on the 4-hour chart of the BNB/USD pair (data source from Binance).
- The pair might gain bullish momentum above $245 and $250.
Binance Coin Price Eyes Fresh Increase
In the past few days, BNB price saw a couple of swing moves from $245. The bulls struggled to push the price above the $250 resistance. The price reacted to the downside a couple of times and tested the $235 support zone.
A low is formed near $253.6 and the price is attempting a fresh increase, unlike Bitcoin and Ethereum. There was a move above the $240 resistance. The price spiked above the 23.6% Fib retracement level of the downward move from the $262 swing high to the $235 low.
There was also a break above a key bearish trend line with resistance near $240 on the 4-hour chart of the BNB/USD pair. BNB price is now trading below $245 and the 100 simple moving average (4 hours).
On the upside, it is facing resistance near the $245 level. The next major resistance is near $250 or the 50% Fib retracement level of the downward move from the $262 swing high to the $235 low. A close above the $250 resistance might increase the chances of a push above the $255 resistance.
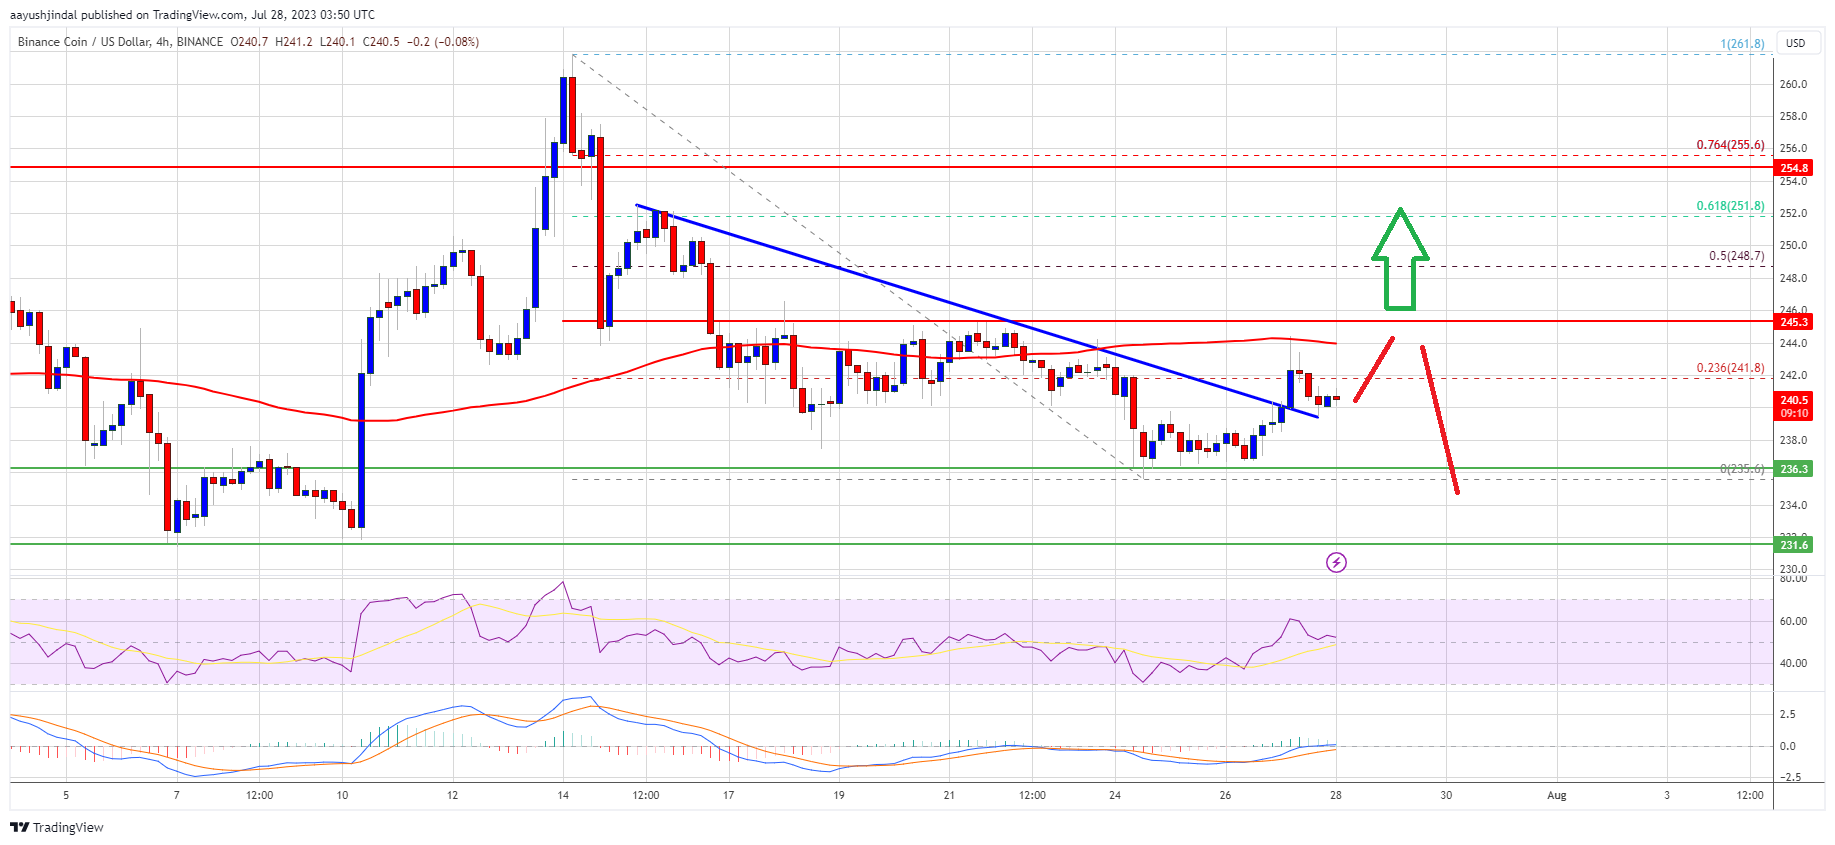
Source: BNBUSD on TradingView.com
A clear move above the $255 resistance might start a steady increase. The next major resistance is near the $262 level, above which the price might rise toward the $270 resistance.
Another Decline in BNB?
If BNB fails to clear the $245 resistance, it could start another decline. Initial support on the downside is near the $236 level.
The next major support is near the $232 level. If there is a downside break below the $232 support, the price could drop toward the $220 support. Any more losses could send the price toward the $212 support.
Technical Indicators
4-Hours MACD – The MACD for BNB/USD is losing pace in the bullish zone.
4-Hours RSI (Relative Strength Index) – The RSI for BNB/USD is currently above the 50 level.
Major Support Levels – $236, $232, and $220.
Major Resistance Levels – $245, $250, and $255.


