
Reason to trust
How Our News is Made
Strict editorial policy that focuses on accuracy, relevance, and impartiality
Ad discliamer
Morbi pretium leo et nisl aliquam mollis. Quisque arcu lorem, ultricies quis pellentesque nec, ullamcorper eu odio.
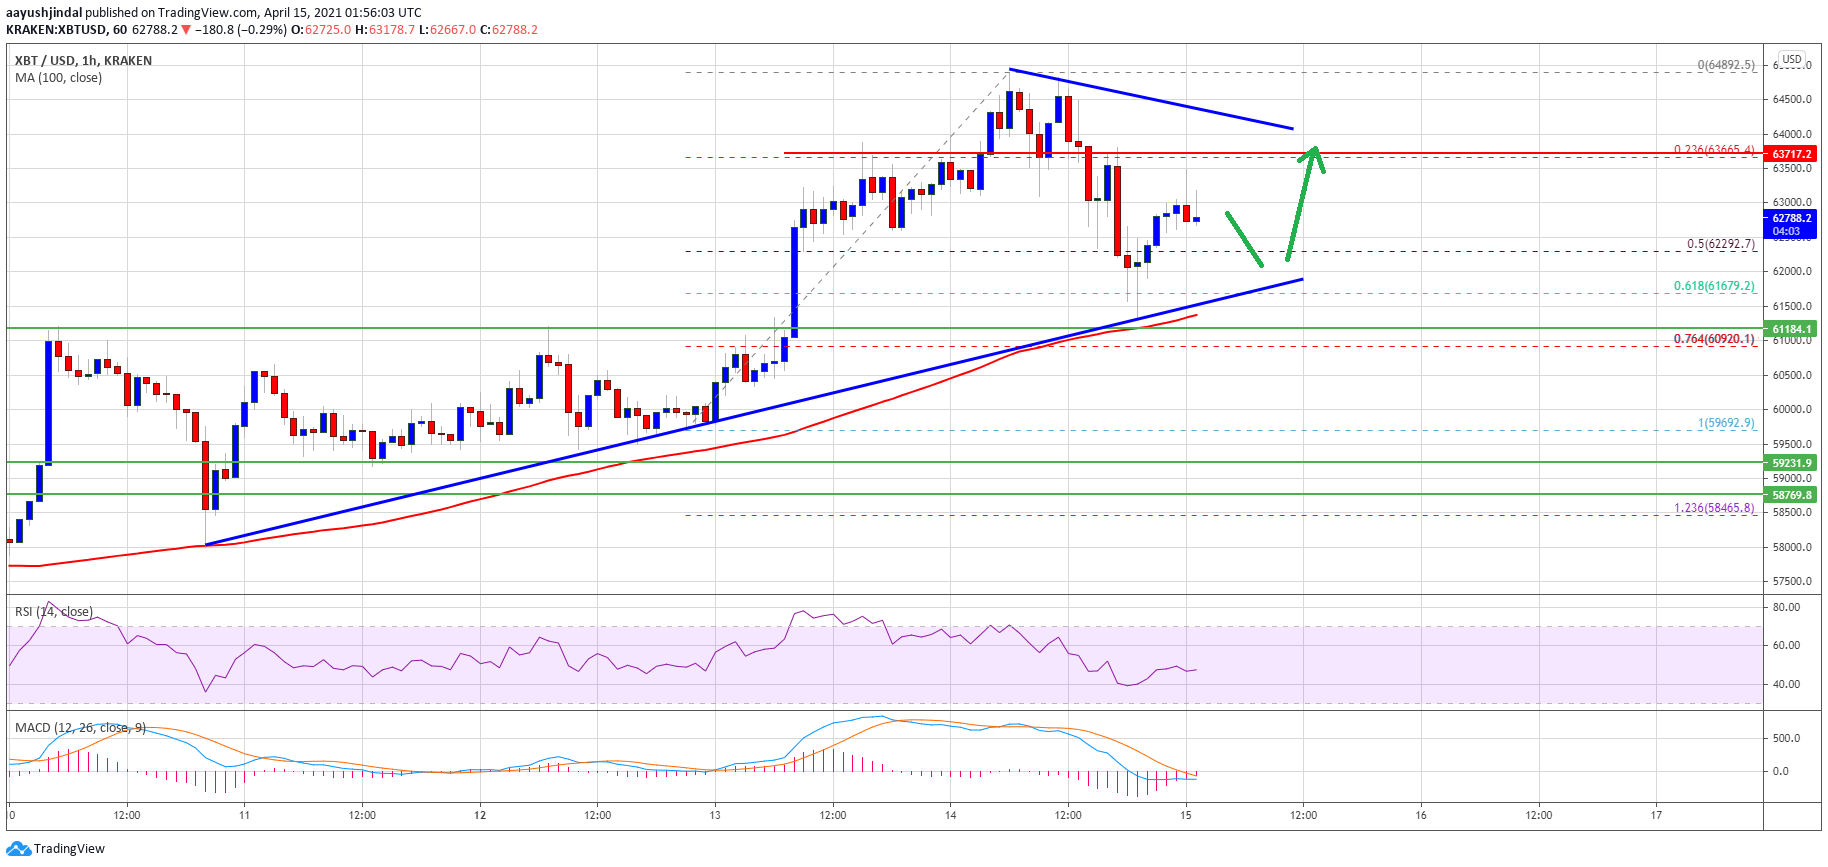
Bitcoin price traded to a new all-time high near $64,892 before correcting lower against the US Dollar. BTC tested the $61,500 level and it is now showing a few positive signs.
- Bitcoin climbed further above the $63,000 and $64,000 resistance levels.
- The price is now trading well above the $62,000 level and the 100 hourly simple moving average.
- There is a major bullish trend line forming with support near $61,850 on the hourly chart of the BTC/USD pair (data feed from Kraken).
- The pair is likely to start a fresh increase as long as it is above the $61,120 support zone.
Bitcoin Price is Correcting Gains
Bitcoin remained in a positive zone above the $62,000 level. BTC even extended its rise above the $63,000 and $64,000 resistance levels. It traded to a new all-time high at $64,892 before it started a downside correction.
There was a break below the $64,000 and $63,000 levels. The price declined below the 50% Fib retracement level of the upward move from the $59,700 swing low to $64,892 high. There was even a spike below the $62,000 support zone.
However, the bulls appeared near the $61,500 level. It remained well bid near the 61.8% Fib retracement level of the upward move from the $59,700 swing low to $64,892 high.
Source: BTCUSD on TradingView.com
There is also a major bullish trend line forming with support near $61,850 on the hourly chart of the BTC/USD pair. The pair is now recovering, and trading well above the $62,000 level and the 100 hourly simple moving average.
An initial resistance is near the $63,500 and $63,700 levels. The next major resistance is near the $64,000 level, above which the price is likely to climb to a new all-time high.
Dips Limited in BTC?
If bitcoin fails to climb above $63,500 and $63,700, there could be another downside correction. An initial support on the downside is near the $62,000 level.
The main support is now forming near the $61,800 level and the trend line. A downside break below the trend line support might call for a test of the key $61,120 support zone in the near term.
Technical indicators:
Hourly MACD – The MACD is now losing momentum in the bullish zone.
Hourly RSI (Relative Strength Index) – The RSI for BTC/USD is now close to the 50 level.
Major Support Levels – $61,800, followed by $61,120.
Major Resistance Levels – $63,500, $63,700 and $64,000.


