
Reason to trust
How Our News is Made
Strict editorial policy that focuses on accuracy, relevance, and impartiality
Ad discliamer
Morbi pretium leo et nisl aliquam mollis. Quisque arcu lorem, ultricies quis pellentesque nec, ullamcorper eu odio.
Bitcoin is currently correcting higher from the $3,906 swing low against the US Dollar. BTC is now forming a crucial breakout pattern, which is likely to decide the next move.
- Bitcoin price seems to be facing a lot of hurdles on the upside near $5,500 and $5,950.
- The price is now trading well below $6,500 pivot area and the 100 simple moving average (4-hours).
- There is a crucial contracting triangle forming with resistance near $5,350 on the 4-hours chart of the BTC/USD pair (data feed from Kraken).
- The pair could either recover towards the $6,500 resistance area or it might start a fresh decline.
Bitcoin is Facing Hurdles
This past week, bitcoin saw a strong decline below the $6,000 and $5,000 levels against the US Dollar. BTC price even spiked below the $4,200 support level and settled well below the 100 simple moving average (4-hours).
A new multi-month low is formed near the $3,906 level and the price is currently correcting higher. It recovered losses and climbed above the $4,500 and $5,000 resistance levels. Besides, there was a break above the 23.6% Fib retracement level of the key drop from the $7,974 high to $3,906 low.
Bitcoin bulls were able to push the price above the $5,500 resistance level. However, the $6,000 resistance area acted as a strong barrier for the bulls. The 50% Fib retracement level of the key drop from the $7,974 high to $3,906 low is also acting as a key resistance.
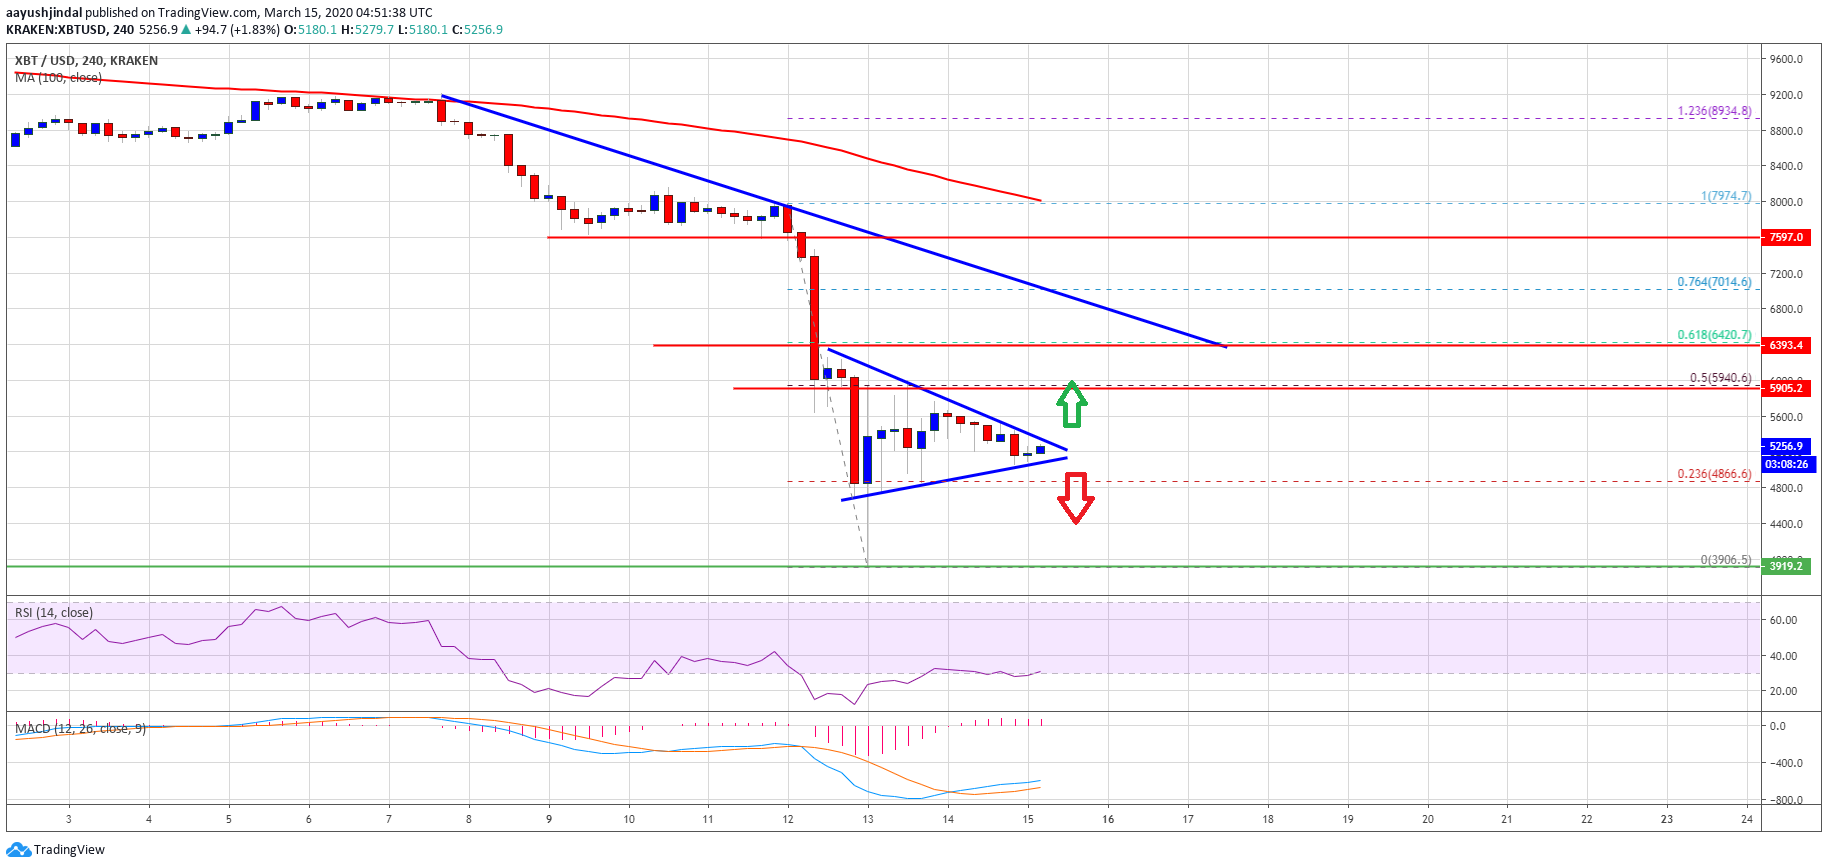
At the moment, there is a crucial contracting triangle forming with resistance near $5,350 on the 4-hours chart of the BTC/USD pair. If the pair breaks the triangle resistance, it could revisit the $6,000 resistance area.
The main resistance is waiting near the $6,450 and $6,500 levels. There is also a connecting bearish trend line forming with resistance near $6,450 on the same chart.
To start a fresh increase and a convincing recovery, the price must surpass the $6,000 resistance and then gain pace above the $6,500 barrier.
More Downsides?
If bitcoin price fails to climb above $5,500 or $6,000, there is a risk of another bearish break. A clear move below the $5,000 and $4,850 levels is likely to open the doors for more losses.
An initial support is near the $4,200 level, below which the price might retest $4,000. Any further losses could set the pace for a move towards the $3,600 level.
Technical indicators
4 hours MACD – The MACD for BTC/USD is about to move back into the bearish zone.
4 hours RSI (Relative Strength Index) – The RSI for BTC/USD is currently just above the 30 level.
Major Support Level – $4,850
Major Resistance Level – $6,000


