
Reason to trust
How Our News is Made
Strict editorial policy that focuses on accuracy, relevance, and impartiality
Ad discliamer
Morbi pretium leo et nisl aliquam mollis. Quisque arcu lorem, ultricies quis pellentesque nec, ullamcorper eu odio.
Bitcoin is struggling to gain bullish momentum above $11,300 against the US Dollar. BTC could extend its decline unless it surges past the 100 hourly SMA.
- Bitcoin is facing a strong resistance near the $11,300 and $11,400 levels.
- The price is now trading well below the $11,400 level and the 100 hourly simple moving average.
- There is a short-term declining channel forming with resistance near $11,230 on the hourly chart of the BTC/USD pair (data feed from Kraken).
- The pair is likely to remain well bid near the $11,000 and $10,840 levels in the near term.
Bitcoin Price is Facing Hurdles
In the past few sessions, bitcoin price struggled to gain bullish momentum above the $11,300 and $11,400 levels against the US Dollar. The last swing high was near $11,374 before BTC started a steady decline.
It traded below the $11,200 level and settled well below the 100 hourly simple moving average. The recent low was near $11,035 and the price is currently correcting higher. It surpassed the 23.6% Fib retracement level of the recent decline from the $11,374 high to $11,035 swing low.
The price is currently facing hurdles near the $11,200 level. There is a short-term declining channel forming with resistance near $11,230 on the hourly chart of the BTC/USD pair.
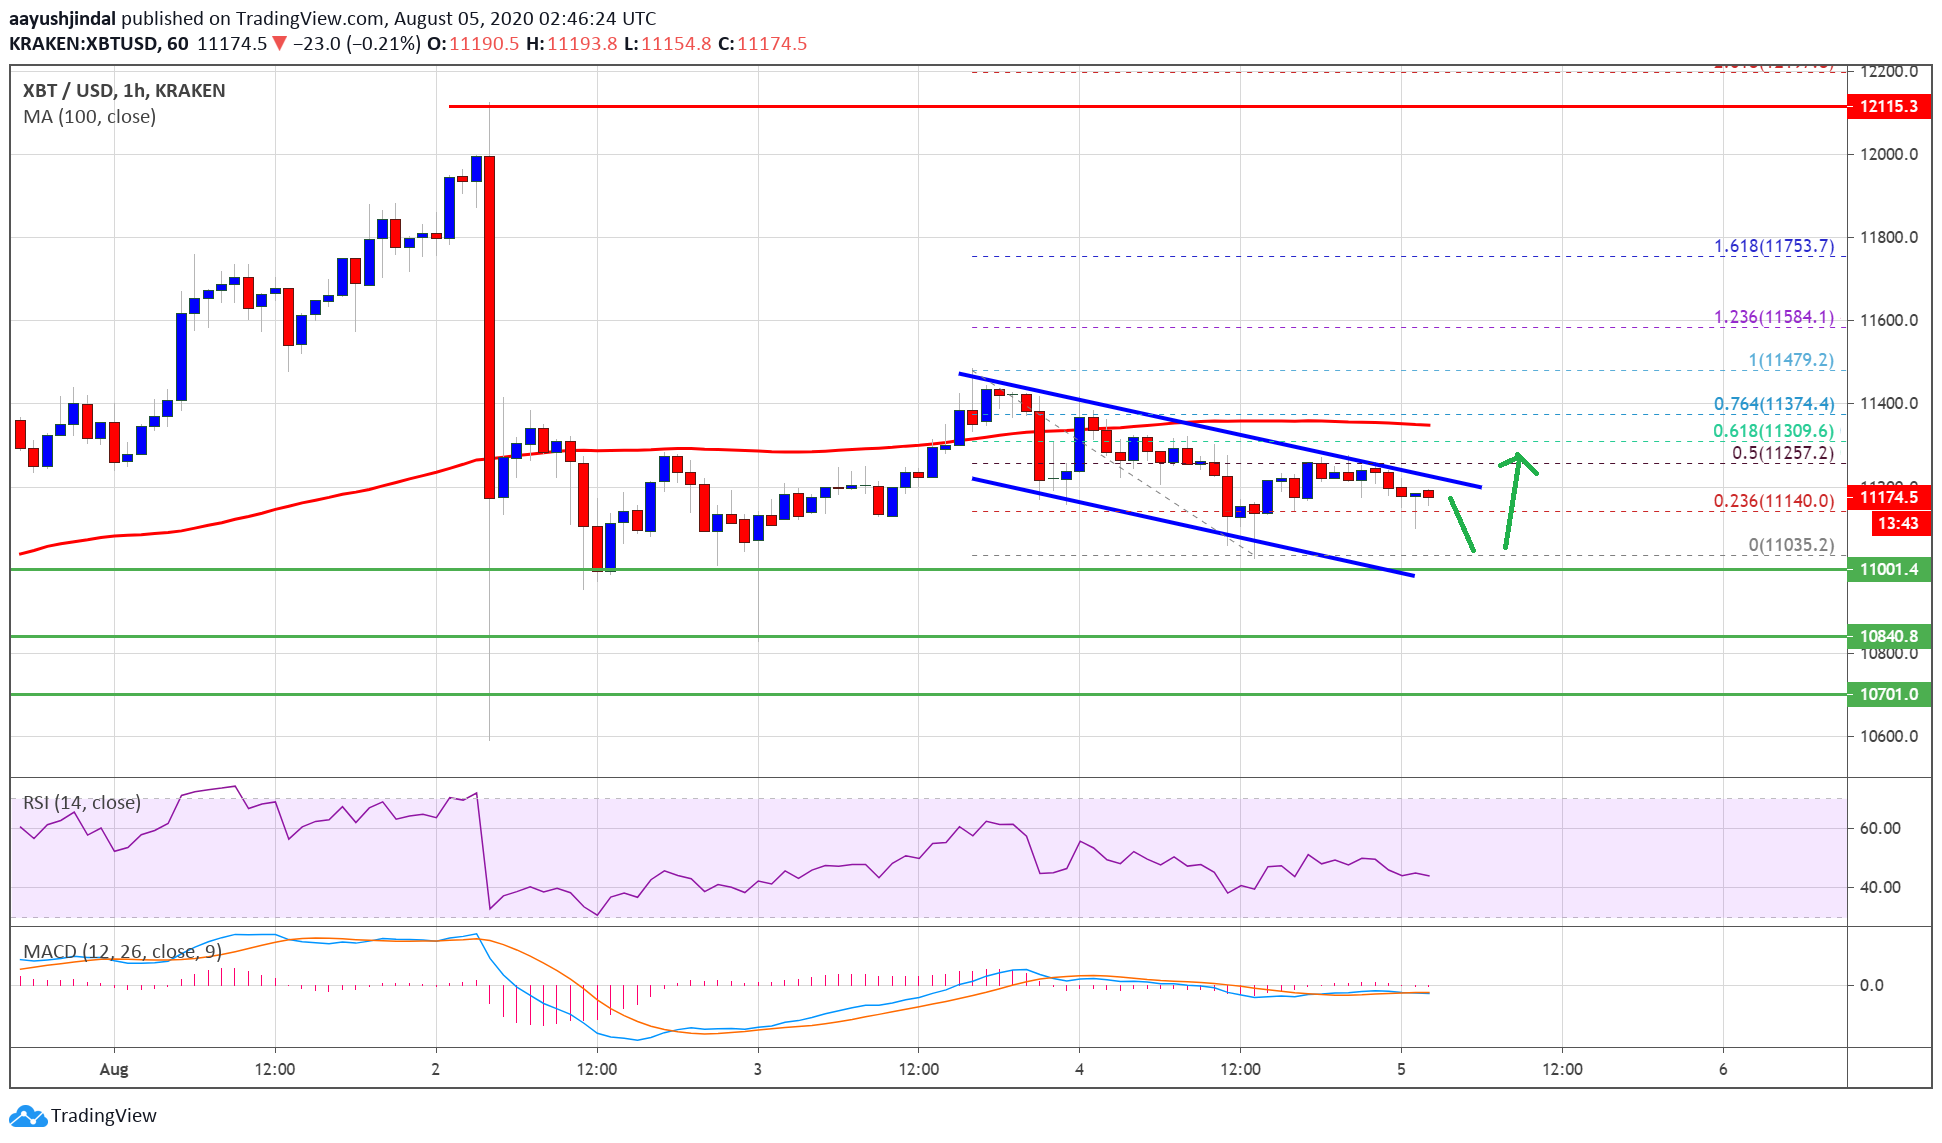
Bitcoin price trades above $11,200. Source: TradingView.com
Above the channel resistance, the $11,250 is a key hurdle. The 50% Fib retracement level of the recent decline from the $11,374 high to $11,035 swing low is also near the $11,250 level to act as a hurdle. The main hurdle is still near the $11,350 and $11,400 levels.
A successful close above the $11,400 level is needed for a fresh increase since it is close to the 100 hourly simple moving average. In the mentioned case, the price could rally towards the $11,600 and $11,800 levels.
Downside Break in BTC?
If bitcoin fails to clear the channel resistance or the 100 hourly SMA, there is a risk of a sharp decline below the $11,000 support level.
A clear break below the $11,000 support level could lead the price towards the $10,850 support zone. The next major support is near the $10,550 level, where the bulls are likely to take a stand.
Technical indicators:
Hourly MACD – The MACD is slowly moving into the bullish zone.
Hourly RSI (Relative Strength Index) – The RSI for BTC/USD is currently rising towards the 50 level.
Major Support Levels – $11,000, followed by $10,850.
Major Resistance Levels – $11,250, $11,350 and $11,400.


