
Reason to trust
How Our News is Made
Strict editorial policy that focuses on accuracy, relevance, and impartiality
Ad discliamer
Morbi pretium leo et nisl aliquam mollis. Quisque arcu lorem, ultricies quis pellentesque nec, ullamcorper eu odio.
Bitcoin struggled to clear the $12,000 resistance zone and corrected lower against the US Dollar. BTC’s daily chart suggests the price could extend its decline towards the $10,500 support.
- Bitcoin topped near the $12,080 level and it is currently correcting gains.
- The price is trading below the $11,500 support and approaching the next major support.
- There is a key bullish trend line forming with support near $11,240 on the daily chart of the BTC/USD pair (data feed from Kraken).
- The pair could start an extended decline towards the $10,500 level if it breaks the trend line support.
Bitcoin Price Correcting Gains
Earlier this month, bitcoin price gained bullish momentum above the $11,00 level against the US Dollar. BTC even broke the $11,500 resistance and settled well above the 100-day simple moving average.
There was a break above the $12,000 level and the price climbed to a new monthly high near $12,100. However, it failed to stay above the $12,000 level and recently started a downside correction. The bears were able to push the price below the $11,800 level.
Bitcoin price traded below the 23.6% Fib retracement level of the upward move from the $9,000 swing low to $12,100 swing high. It is now trading near the $11,300 level. There is also a key bullish trend line forming with support near $11,240 on the daily chart of the BTC/USD pair.
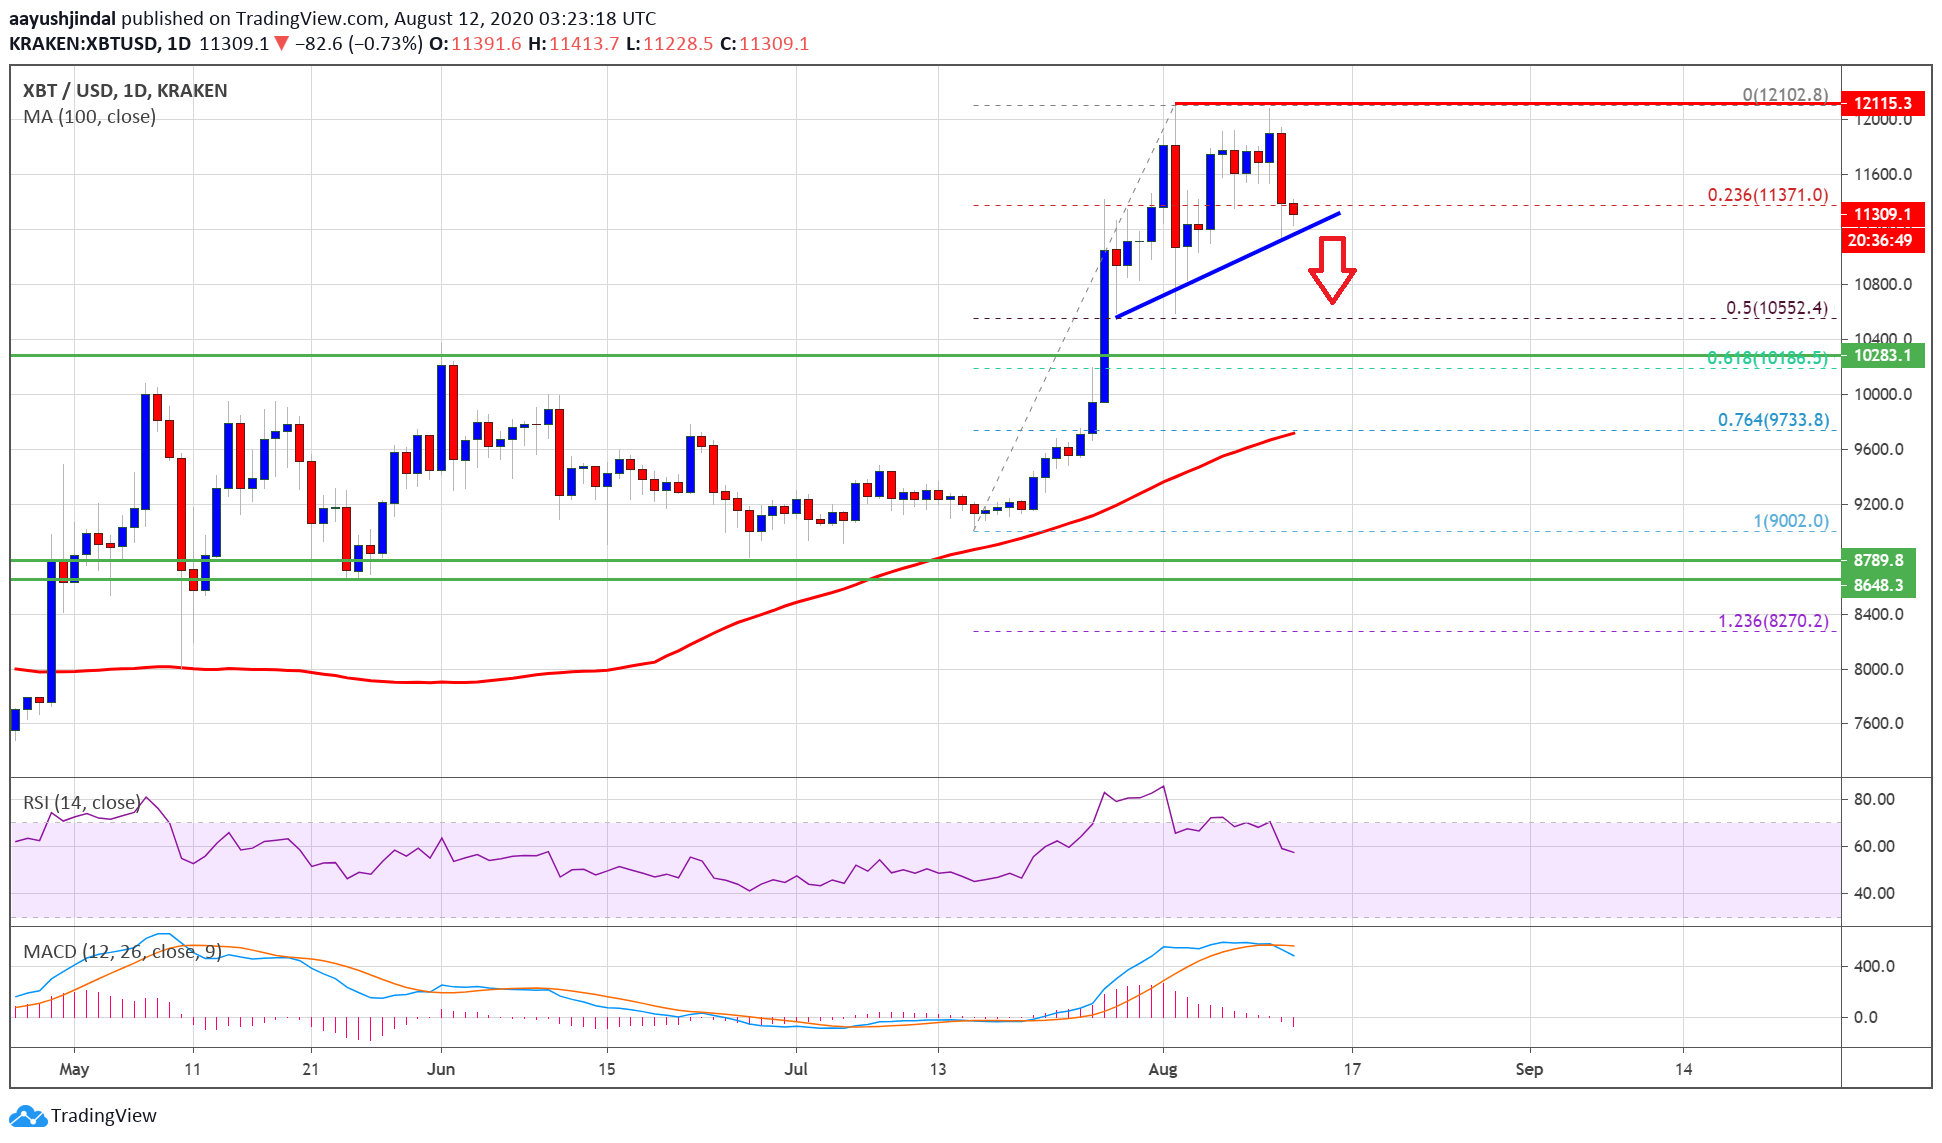
Bitcoin price trades below $11,500: Source: TradingView.com
If the pair breaks the trend line support, there is a risk of an extended decline. The next major support is near the $11,000. The main support is near the $10,500 level or the 50% Fib retracement level of the upward move from the $9,000 swing low to $12,100 swing high.
Fresh Increase?
If bitcoin price stays above the trend line support or $11,200, it could bounce back. An initial resistance is near the $11,500 level, above which the bulls could gain strength.
The main hurdle is still near the $12,000 barrier, above which the price is likely to start another strong rally in the coming days. In the mentioned case, it could rise towards the $12,400 and $12,500 levels.
Technical indicators:
Daily MACD – The MACD is slowly moving into the bearish zone.
Daily RSI (Relative Strength Index) – The RSI for BTC/USD is now correcting lower towards the 50 level.
Major Support Levels – $11,200 followed by $11,000.
Major Resistance Levels – $11,500, $11,800 and $12,000.


