
Reason to trust
How Our News is Made
Strict editorial policy that focuses on accuracy, relevance, and impartiality
Ad discliamer
Morbi pretium leo et nisl aliquam mollis. Quisque arcu lorem, ultricies quis pellentesque nec, ullamcorper eu odio.
Bitcoin price is up over 3% and it gained strength from the $13,000 support against the US Dollar. BTC is now facing a heavy resistance near the $13,650 and $13,700 levels.
- Bitcoin remained well bid above the $13,000 level and it started a fresh increase.
- The price broke the $13,500 resistance and settled above the 100 hourly simple moving average.
- There is a connecting bullish trend line forming with support near $13,050 on the hourly chart of the BTC/USD pair (data feed from Kraken).
- The pair must settle above $13,650 and $13,700 to continue higher in the near term.
Bitcoin Price Starts Fresh Increase
Yesterday, we saw a sharp downside correction in bitcoin price below the $13,500 support level. BTC even broke the $13,200 support level and spiked below $13,000.
However, dips were limited below the $13,000 support and the price bounced back sharply. It broke the $13,200 and $13,380 levels to move back into a positive zone. There was also a break above the $13,500 resistance and the price settled nicely above the 100 hourly simple moving average.
Bitcoin is now facing a heavy resistance near the $13,650 and $13,700 levels. It already made two attempt to gain strength above $13,650, but failed.
The recent high was formed near $13,672 and the price is currently correcting lower. It broke the $13,500 level, plus traded below the 23.6% Fib retracement level of the upward move from the $13,976 swing low to $13,672 high.
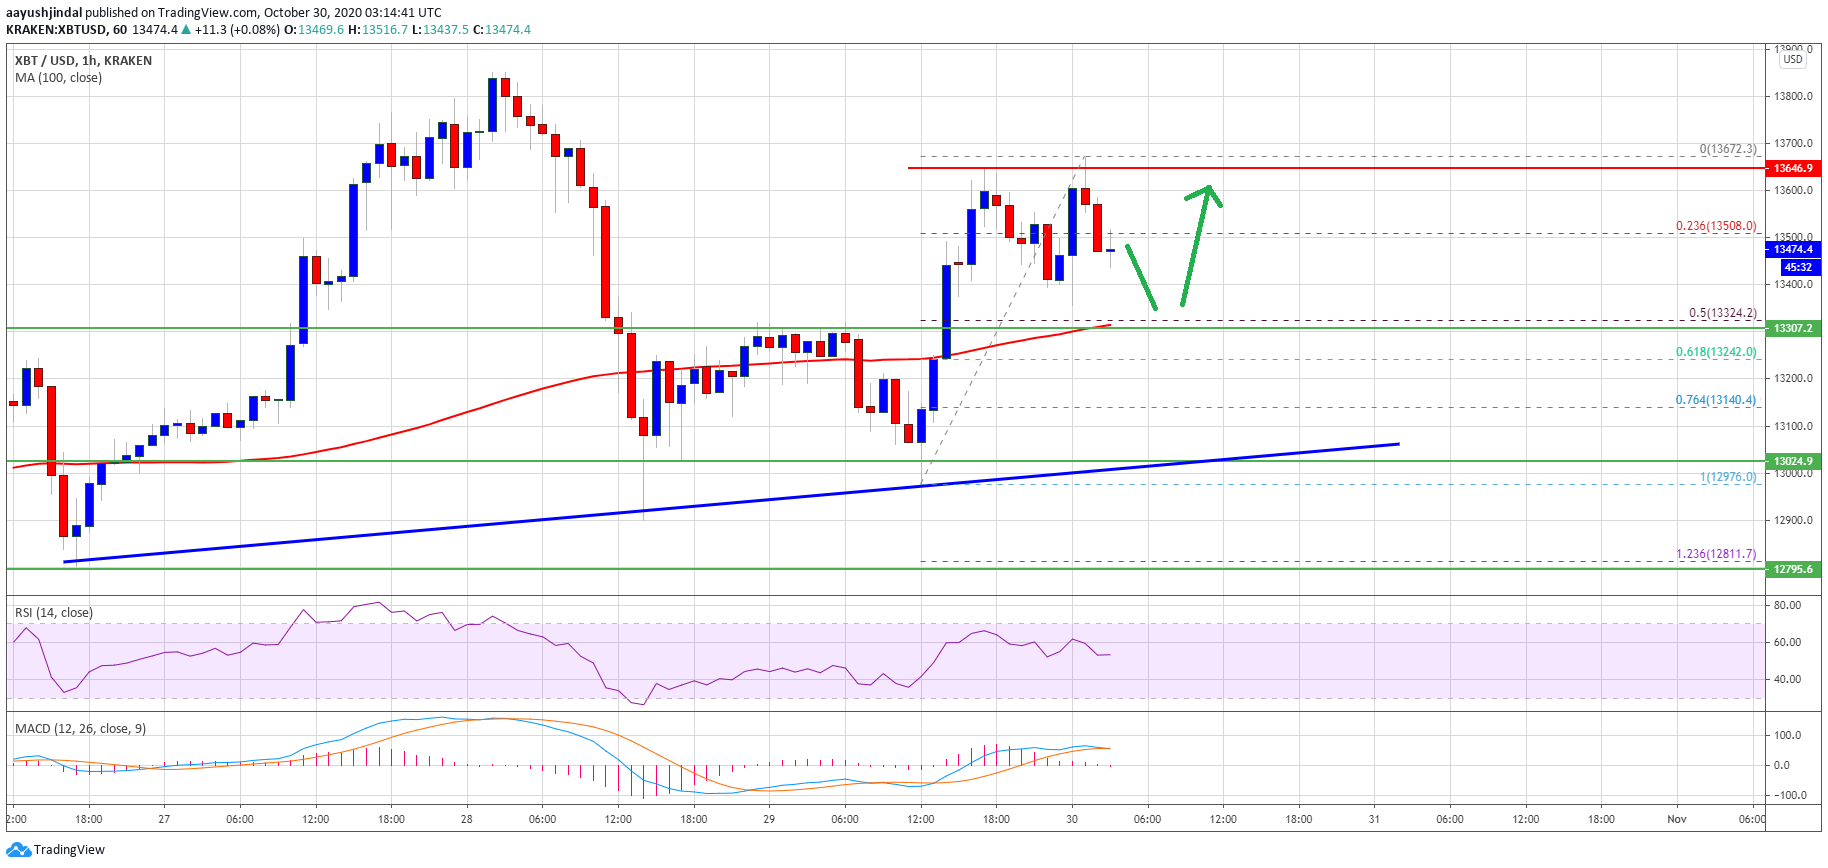
Source: BTCUSD on TradingView.com
There is a major support forming on the downside near the $13,330 level and the 100 hourly simple moving average. It is close to the 50% Fib retracement level of the upward move from the $13,976 swing low to $13,672 high. There is also a connecting bullish trend line forming with support near $13,050 on the hourly chart of the BTC/USD pair.
On the upside, the bulls need to clear the $13,650 and $13,700 resistance levels to continue higher. In the stated case, the price could easily drift towards the $14,000 resistance.
Downside Break in BTC?
If bitcoin fails to clear the $13,650 and $13,700 resistance levels, there is a risk of a downside break. The first key support is near the $13,330 level and the 100 hourly SMA.
A downside break below the $13,330 level and the 100 hourly SMA could spark a fresh increase in selling. In the stated case, the bears may perhaps attempt a bearish break below the trend line and $13,000.
Technical indicators:
Hourly MACD – The MACD is slowly moving back into the bearish zone.
Hourly RSI (Relative Strength Index) – The RSI for BTC/USD is still above the 50 level.
Major Support Levels – $13,330, followed by $13,000.
Major Resistance Levels – $13,650, $13,700 and $14,000.


