
Reason to trust
How Our News is Made
Strict editorial policy that focuses on accuracy, relevance, and impartiality
Ad discliamer
Morbi pretium leo et nisl aliquam mollis. Quisque arcu lorem, ultricies quis pellentesque nec, ullamcorper eu odio.
Bitcoin broke the key $40,000 resistance zone against the US Dollar. BTC is up over 12% and might continue to rise above the $43,000 level.
- Bitcoin surged above a few key hurdles near the $40,000 resistance zone.
- The price is trading above $42,000 and the 100 hourly simple moving average.
- There was a break above a key bearish trend line with resistance near $38,000 on the hourly chart of the BTC/USD pair (data feed from Kraken).
- The pair has moved into a bullish zone and might accelerate higher towards $45,000.
Bitcoin Price Surges
Bitcoin price remained in a positive zone above the $38,00- pivot level. BTC was able to start a major increase after it cleared the $38,800 resistance zone.
There was a break above a key bearish trend line with resistance near $38,000 on the hourly chart of the BTC/USD pair. It opened the doors for a sharp increase above the $40,000 resistance and the 100 hourly simple moving average.
The price rallied over 10% and there was a clear move above the $42,000 resistance zone. It even cleared the $43,000 level and traded as high as $44,192.
Bitcoin is now consolidating and trading well above the 23.6% Fib retracement level of the upward move from the $37,029 swing low to $44,192 high. On the upside, an immediate resistance is near the $44,000 level. The first key resistance is near the $44,200 level.
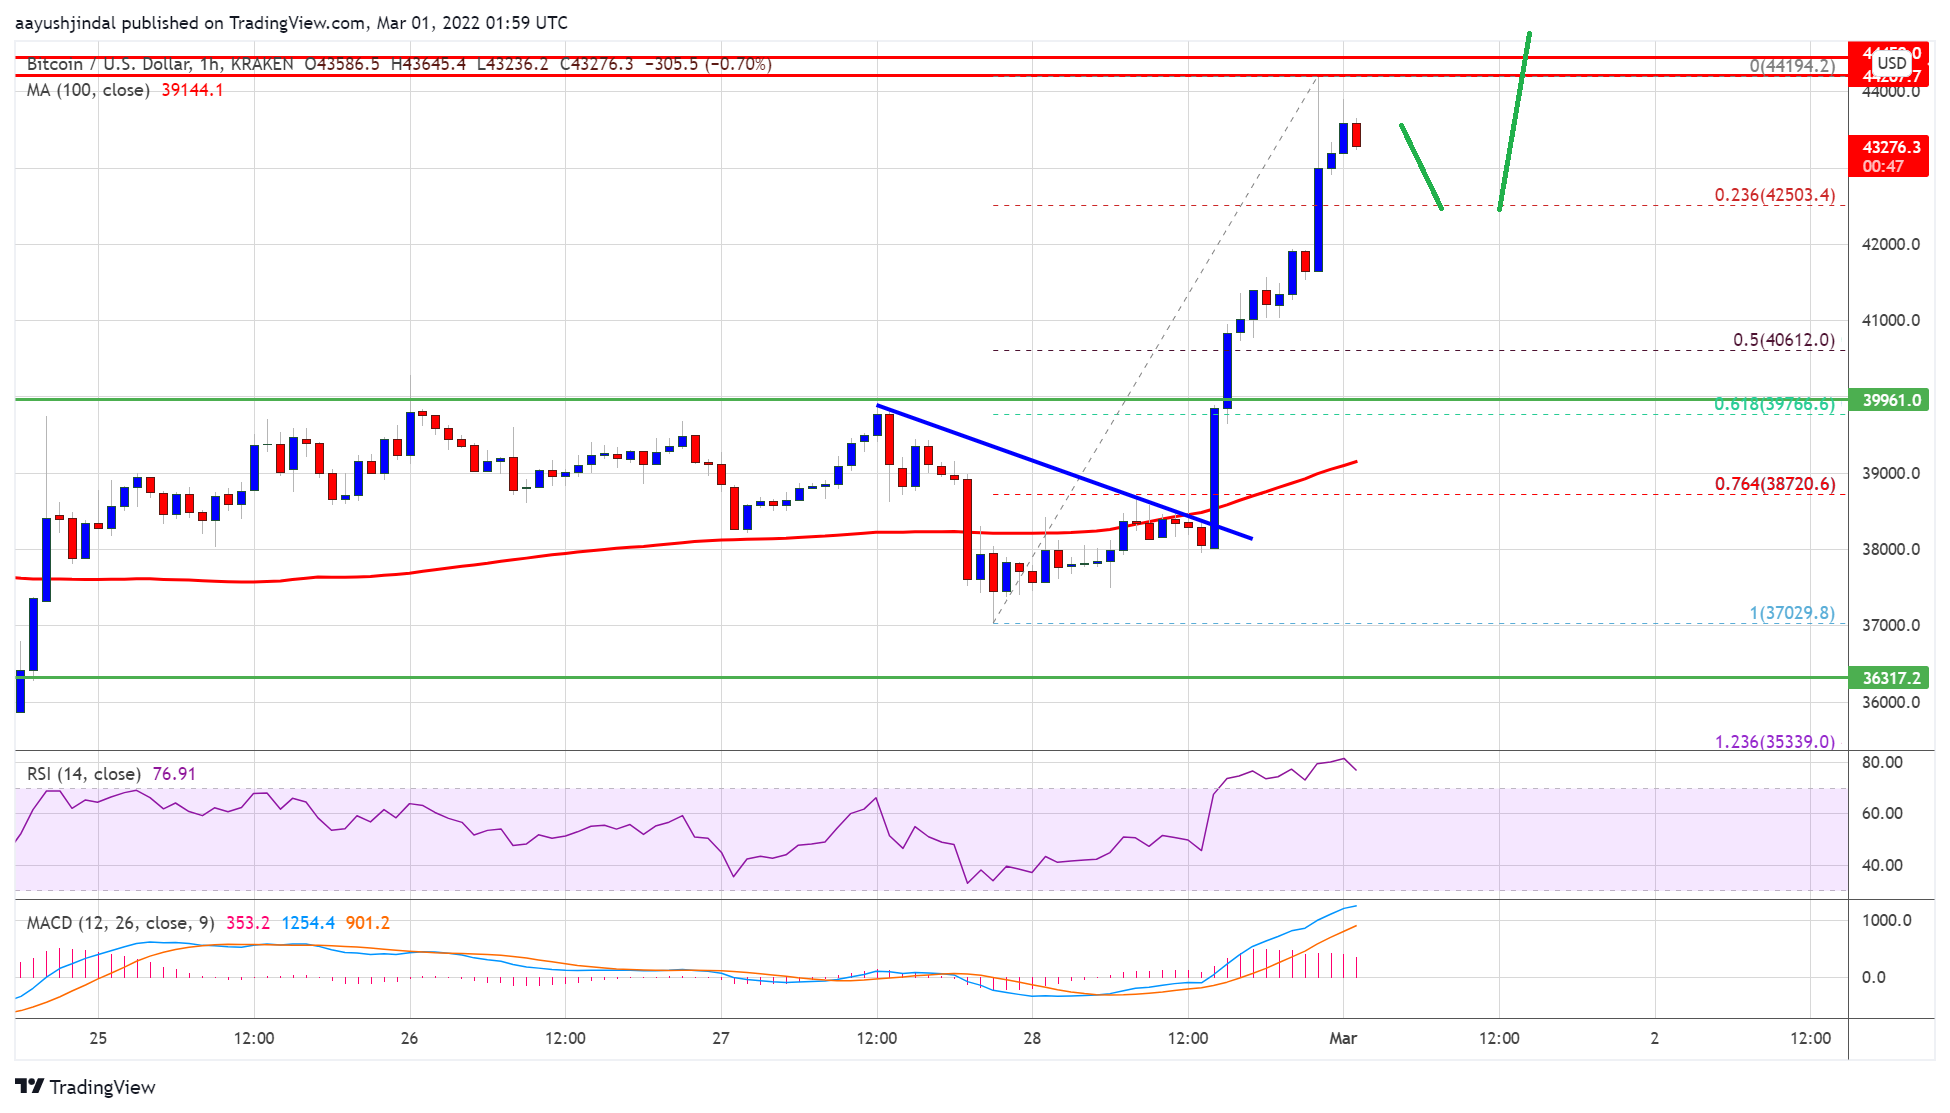
Source: BTCUSD on TradingView.com
The main resistance is now near the $44,500 level. A clear move above the $44,500 resistance could send the price further higher. In the stated case, it could even attempt a clear move above $45,000.
Dips Limited in BTC?
If bitcoin fails to clear the $44,200 resistance zone, it could start a downside correction. An immediate support on the downside is near the $43,000 zone.
The next major support is seen near the $42,500 level. If there is a downside break below the $42,500 support, the price might gain bearish momentum towards $40,500. It is near the 50% Fib retracement level of the upward move from the $37,029 swing low to $44,192 high.
Technical indicators:
Hourly MACD – The MACD is now losing pace in the bullish zone.
Hourly RSI (Relative Strength Index) – The RSI for BTC/USD is correcting from the overbought zone.
Major Support Levels – $43,000, followed by $42,500.
Major Resistance Levels – $44,000, $44,200 and $45,000.


