Reason to trust

How Our News is Made
Strict editorial policy that focuses on accuracy, relevance, and impartiality
Ad discliamer
Morbi pretium leo et nisl aliquam mollis. Quisque arcu lorem, ultricies quis pellentesque nec, ullamcorper eu odio.
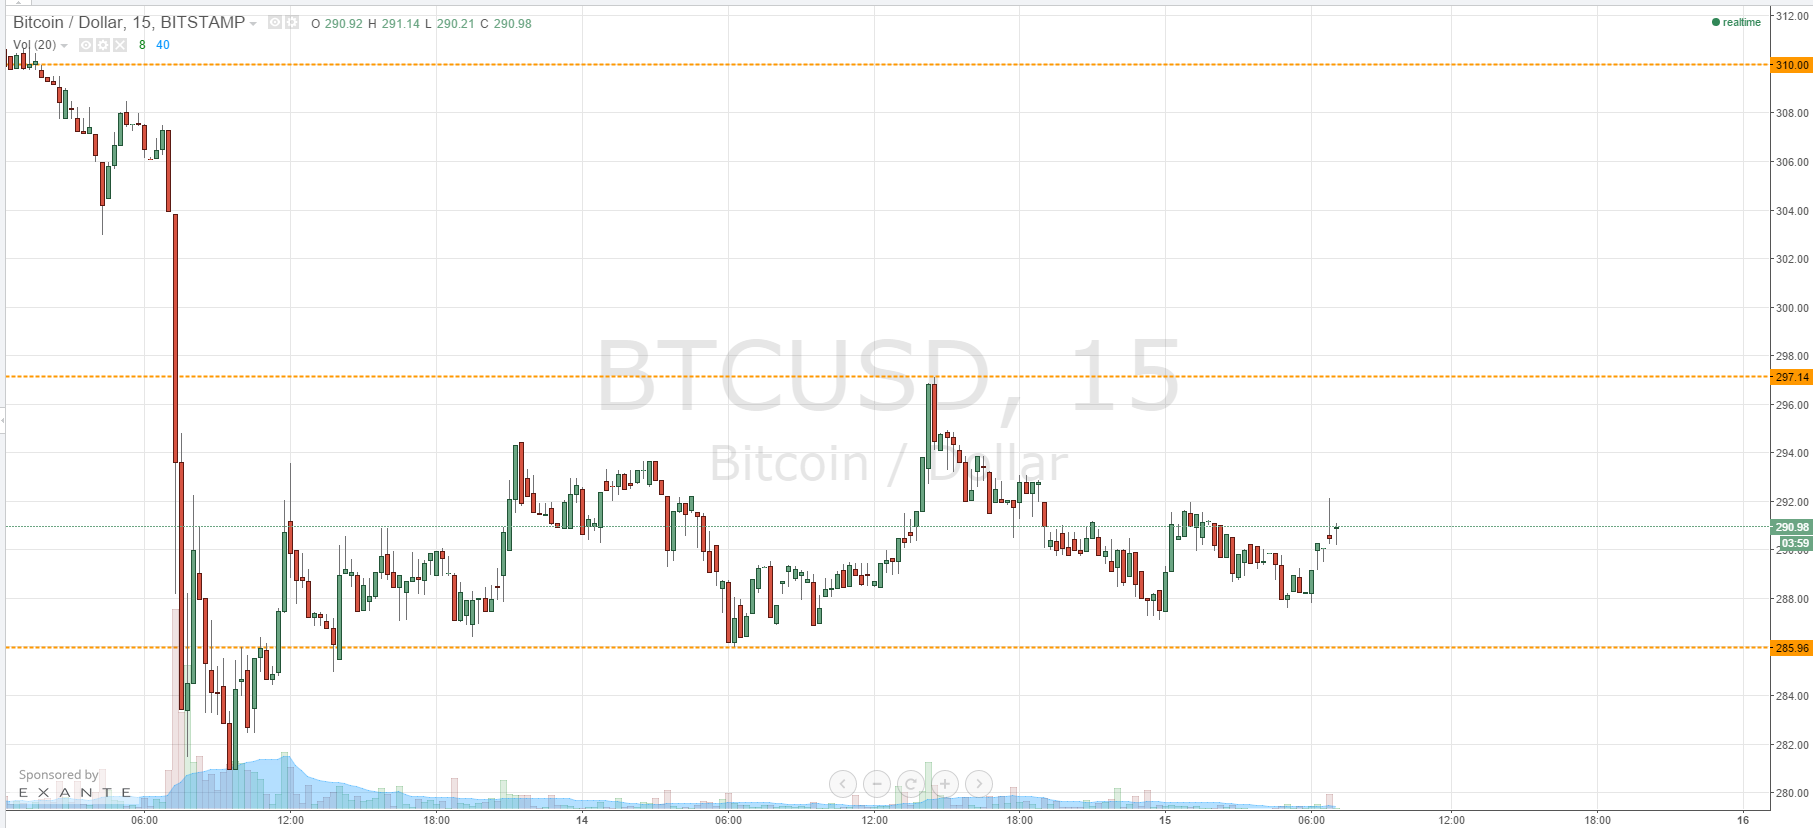
Those of you that have been following our twice-daily bitcoin price analysis pieces over last week or so will be well aware that – since the fundamentally driven bias towards 320, and the ensuing decline – bitcoin has remained relatively stable between a range that we keep covering in these articles. Our intraday breakout strategy dictates that we predefine support and resistance, and enter according to these key levels, either a breakout of resistance to the upside, or support the downside. There is also the potential for intra-range trades if we have wide enough parameters. Unfortunately, when we get pretty flat trading as we have had over the last few days, it can be frustrating, as very few entries present themselves. We got chopped out a few times on Monday, and since then, the bitcoin price has remained relatively tight. With this said, when things wind up like this, there is eventually some sort of release and this can translate to a sharp movement in either direction. So, with this said, the levels that we defined yesterday remain the ones to watch this morning, and we will be on the lookout for a sharp break out in the bitcoin price as we head into the European session.
A quick look at the chart reveals the levels to be 285.96 to the downside (in term support) and 297.14 to the upside (in term resistance). These of levels that will be watching today. If we can break above 297.14, it will validate a medium-term long entry towards 310 flat. As we’ve mentioned a few times already, the may be some friction around 300, so that be afraid to hold on to the position if we get a small correction back towards broken support around the 300 level.
Looking the other way, a break below 285.96 would put us short towards 280 flat, with a stop loss somewhere around 288 maintaining a positive risk reward profile on the trade.
Charts courtesy of Trading View


