
Reason to trust
How Our News is Made
Strict editorial policy that focuses on accuracy, relevance, and impartiality
Ad discliamer
Morbi pretium leo et nisl aliquam mollis. Quisque arcu lorem, ultricies quis pellentesque nec, ullamcorper eu odio.
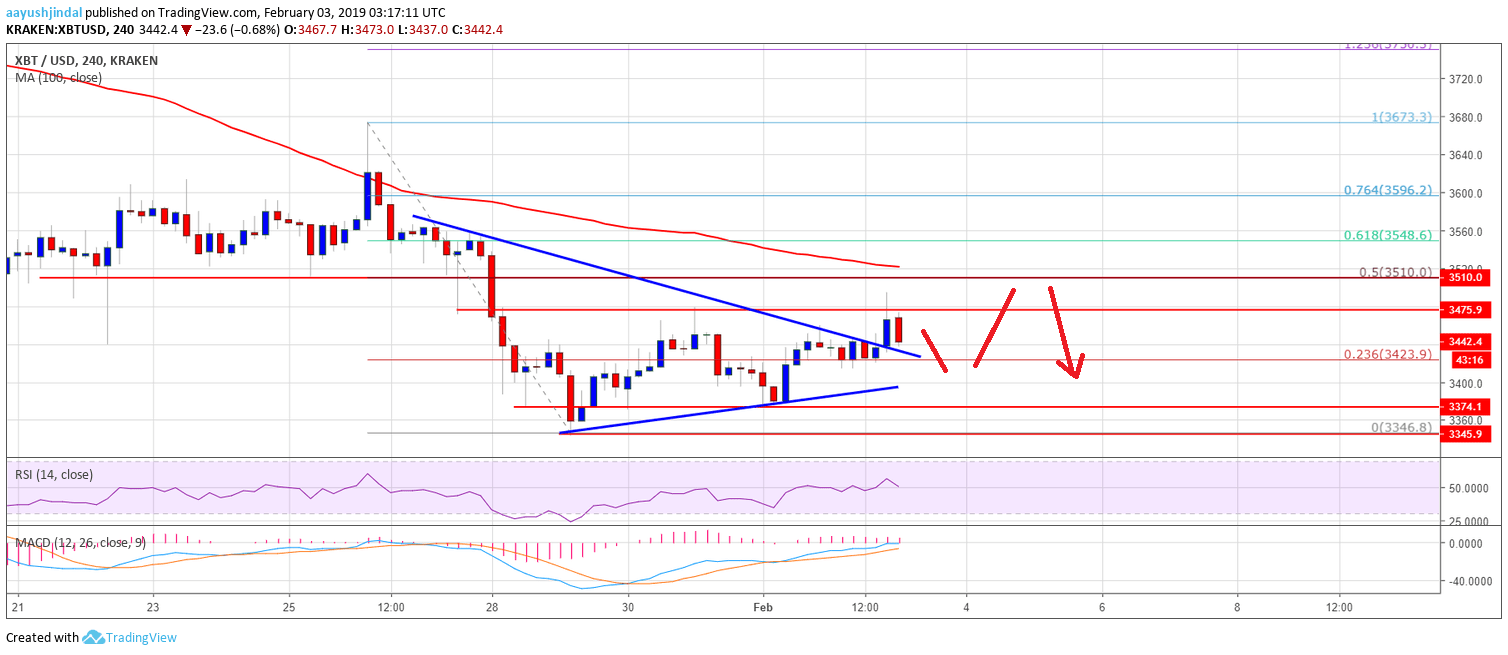
- Bitcoin price formed a support base near $3,370 and recovered higher above $3,450 against the US Dollar.
- There was a break above a major contracting triangle with resistance at $3,440 on the 4-hours chart of the BTC/USD pair (data feed from Kraken).
- The pair seems to be approaching a couple of important resistances near $3,500 and $3,510.
Bitcoin price is slowly moving higher with positive signs against the US Dollar. However, BTC/USD is now approaching a significant hurdle near the $3,500 resistance zone.
Bitcoin Price Analysis
This past week, bitcoin price remained in a bearish zone below the $3,500 resistance against the US Dollar. The BTC/USD pair tested the $3,375 support area on the couple of occasions and later bounced back. The pair moved above the $3,400 and $3,420 resistance levels to start a decent recovery. The price also traded above the 23.6% Fib retracement level of the last decline from the $3,673 high to $3,346 low. There was a positive price action developed above the $3,440 resistance level.
Moreover, there was a break above a major contracting triangle with resistance at $3,440 on the 4-hours chart of the BTC/USD pair. The price spiked above the $3,475 resistance level, but it remained well below the 100 simple moving average (4-hours). Besides, there was no test of the 50% Fib retracement level of the last decline from the $3,673 high to $3,346 low. Buyers failed to clear the $3,500 resistance area, which ignited bearish moves. At the outset, the price is trading near the $3,440 level, with supports near $3,420 and $3,400. If there is a downside break below $3,400, the price is likely to test the $3,350 and $3,320 levels.
Looking at the chart, BTC price is clearly facing a solid resistance near the $3,500 level and the 100 SMA. As long as the price is trading below $3,500, there is a risk of a downside break in the near term.
Technical indicators
4-hours MACD – The MACD for BTC/USD is slightly placed in the bullish zone.
4-hours RSI (Relative Strength Index) – The RSI for BTC/USD is currently well above the 50 level.
Major Support Level – $3,400
Major Resistance Level – $3,500


