Here we are, that time of the week again. The close of the Friday session out of Europe, and as such, time for the final of our twice daily bitcoin price watch analyses for the week. All said, it’s been a pretty wild week. We’ve had a nice combination of sideways, intrarange action (from which we drew a couple of nice profits earlier on in the week by way of our intrarange strategy) and sustained volatility, again from which we managed to get some decent breakout entries. We noted this morning that the overnight action on Thursday was more representative of the latter – the sustained volatility – and action since publication has served to reinforce this point. Specifically, price has continued to gain strength throughout the day, and are seeing some of the highest levels we’ve seen in a while in the bitcoin price.
So, with this said, what are we looking at as we head into the Asian session tonight, and what happens if we break 500 flat as we head into the weekend? Let’s take a look.
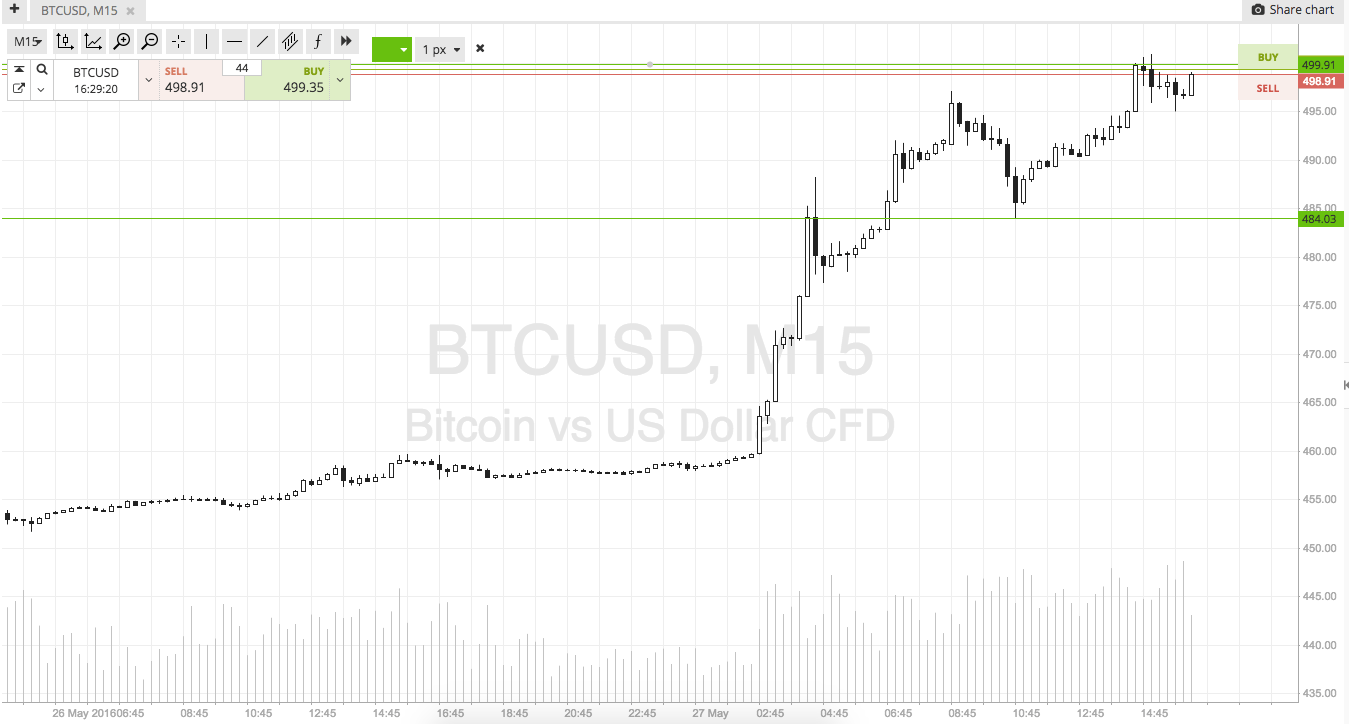
As ever, the chart below shows the key levels we are focusing on near term. It’s a fifteen-minute candlestick chart showing recent action. Get a quick look at it before we get started.

So, our range this evening is defined by in term support at 484, and in term resistance at the aforementioned 500 flat. It’s pretty wide, so intrarange is on for those looking for a more aggressive entry.
From a breakout perspective, a close above 500 flat to the upside (i.e. a break of in term resistance) will signal a long position towards an initial upside target of 510 flat. A stop at 495 gives us a two to one risk reward profile.
A close below support signals short towards 478, with a stop at 487 to keep our risk tight on the trade.
Charts courtesy of SimpleFX
Header Image NewsBTC


