Reason to trust

How Our News is Made
Strict editorial policy that focuses on accuracy, relevance, and impartiality
Ad discliamer
Morbi pretium leo et nisl aliquam mollis. Quisque arcu lorem, ultricies quis pellentesque nec, ullamcorper eu odio.
It’s that time again – our final bitcoin price analysis of the week. As we mentioned this morning, we have had a pretty up and down week, but today – so far at least – has been relatively flat. Action has remained well within our predefined range, and although we have seen a small amount of upside momentum, the real bitcoin price action (i.e. the breakout action that gives us sustained momentum and decent entries) looks like its going to wait until the weekend. This isn’t a problem, but it means we’re pretty restricted as to our potential entries this evening.
With this in mind, and for something a little different, we’re going to outline two approaches – one near term, and one for over the weekend.
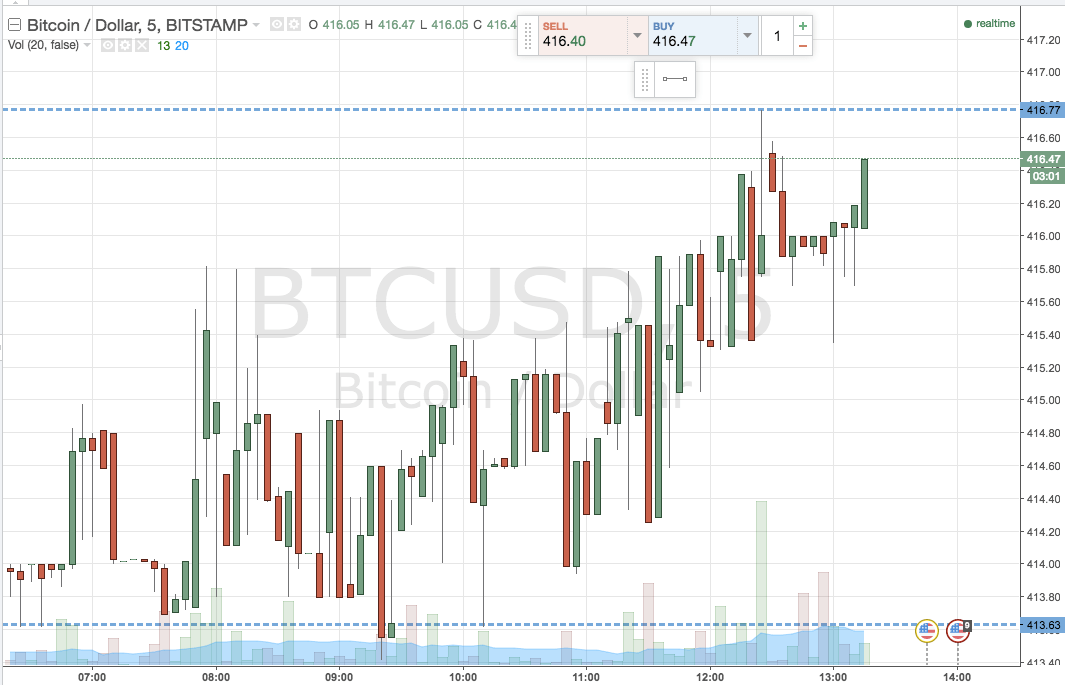
To get an idea of the first one, take a quick look at the chart below.

As the bitcoin price chart shows (it’s a five-minute chart as opposed to our standard fifteen-minute timeframe) we are hovering just shy of a level that we have marked as in term resistance – 416.77, which is the day’s high so far. As our near term entry, we are going to look at shorting an intrarange position as price reverses from resistance. Short towards support, with a stop just the other side of the position entry (somewhere in the region of 419 looks good).
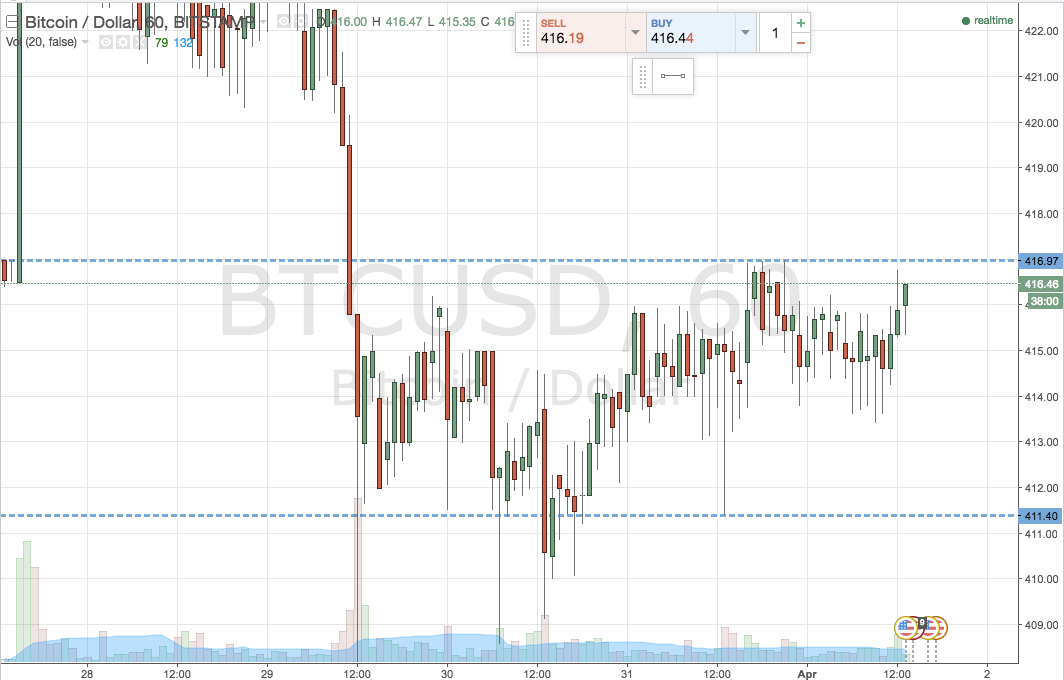
Now looking ahead to the weekend, we’ll zoom out a bit as per the second chart below.

As seen, longer term we are looking at in term support at 411.4, and in term resistance at 417 flat. We’ve had some pretty big moves across the last few weekends, so we’re going to try and use these levels to get in a breakout trade in advance of the action. As usual, long at a close above resistance, short at a close below support. Keep risk pretty loose, but ensure the reward is at least twice the downside (i.e. target a ten-dollar reward for a five dollar risk).
Happy Trading!
Charts courtesy of Trading View


