Reason to trust

How Our News is Made
Strict editorial policy that focuses on accuracy, relevance, and impartiality
Ad discliamer
Morbi pretium leo et nisl aliquam mollis. Quisque arcu lorem, ultricies quis pellentesque nec, ullamcorper eu odio.
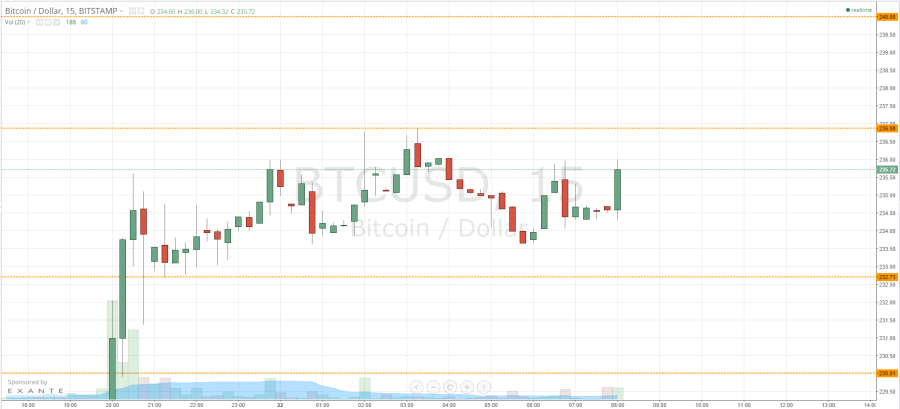
Shortly before markets closed in the UK yesterday evening, we published our twice-daily bitcoin price technical analysis piece. The piece focused on the levels that we had slated throughout the day as our ones to watch, and suggested that if we saw a break of any of these levels, or a bounce from any of them, we would enter a position accordingly and ride it to one of our targets. Action has now matured overnight, and we are heading into a fresh European session this morning. With this said, what are the levels we’re keeping an eye on in the bitcoin price, and the reaching of what levels will signal entry for us? Take a quick look at the chart.
As the chart shows, on Tuesday night, we got a break through in term resistance, and immediately ran through and past our two upside targets for small, but reasonable profits. Since about 10 PM Tuesday (GMT) we have carved out a fresh range, with the levels to keep an eye on as in term support at 232.71 and resistance at 236.88. The breaking of either of these levels will signal entry for us. If we get a run towards 236.88, and a close above this level on an intraday basis, we will enter long with an initial upside target of 240 flat and a stop somewhere around current levels (235.50).
Conversely, if we run back down and get a break below 232.71, it will signal a short entry with a medium-term target of 230.01. In this trade, a stop just ahead of 233.50 will ensure we are taken out of the trade in the event of a bias reversal.
Looking at the range side of things, if we reach support and bounce from it an aggressive long trade could present us with a quick profit towards 236.88 with a stop just below 232 flat.
Charts courtesy of Trading View


