Reason to trust

How Our News is Made
Strict editorial policy that focuses on accuracy, relevance, and impartiality
Ad discliamer
Morbi pretium leo et nisl aliquam mollis. Quisque arcu lorem, ultricies quis pellentesque nec, ullamcorper eu odio.
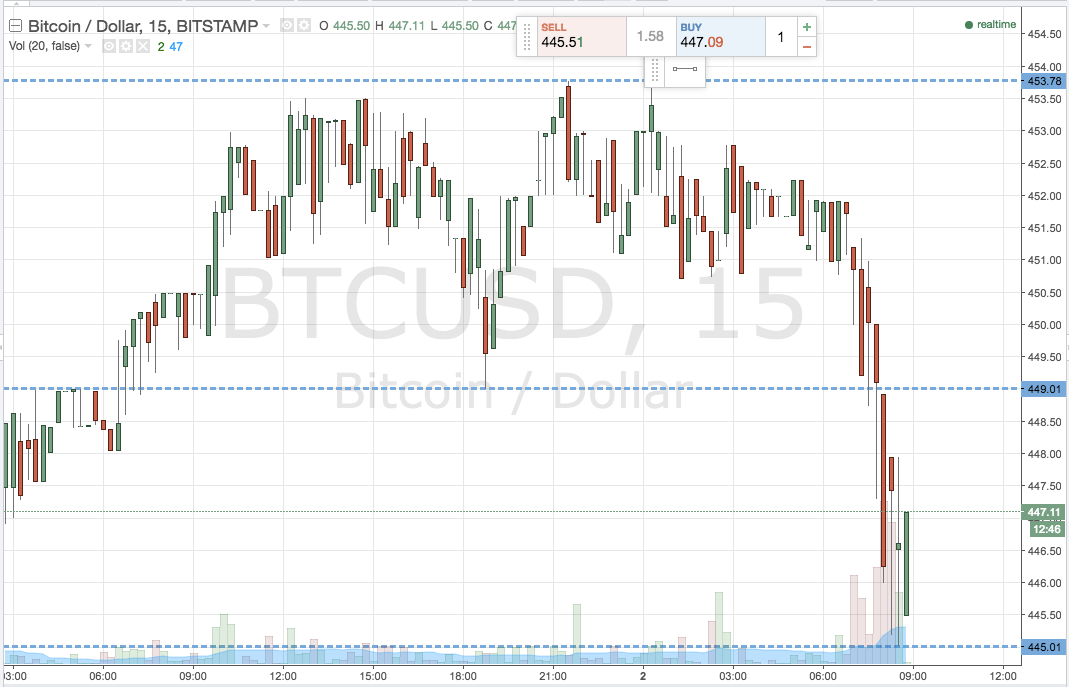
We are entering a fresh week’s trading in the bitcoin price, and, once again, action over the weekend did not disappoint. We have had a number of sharp moves across the last few months when the Sunday session starts, and – in line with this trend – price dropped sharply throughout Sunday evening’s session and into the early Monday morning, to carve out fresh lows just ahead of where it now sits at 447. These lows will play a key role in today’s early morning trading, and the sharp move should help us interpret any volatility that price throws out during early Europe today. So, as we head into today’s session on – the week beyond – where are we looking to get in and out of the markets according to our bitcoin price strategy, and where are our risk and target parameters? As ever, to get an idea what we’re watching, take a quick look at the chart below. It’s an intraday 15-minute candlestick charts, with today’s range overlaid.

As the chart shows, the levels were focusing on today (and those that define today’s range) are support to the downside of 445 flat and resistance to the downside at 449. It’s a pretty tight range, so we will be approaching the market with a breakout strategy only, rather than breakout and intrarange.
With this in mind, a close below support will signal short towards the initial downside target of 440. A stop loss on the straight somewhere in the region of 446 will keep risk tight.
Looking the other way, if price breaks above resistance at 449, we will look to enter long towards 454. It‘s a slightly less aggressive trade, so we’ve got to be a little tighter with our risk. A stop somewhere around 448 good on this position.
Happy trading!
Chart courtesy of Trading View
Header Image courtesy of NewsBTC All Rights Reserved


