Reason to trust

How Our News is Made
Strict editorial policy that focuses on accuracy, relevance, and impartiality
Ad discliamer
Morbi pretium leo et nisl aliquam mollis. Quisque arcu lorem, ultricies quis pellentesque nec, ullamcorper eu odio.
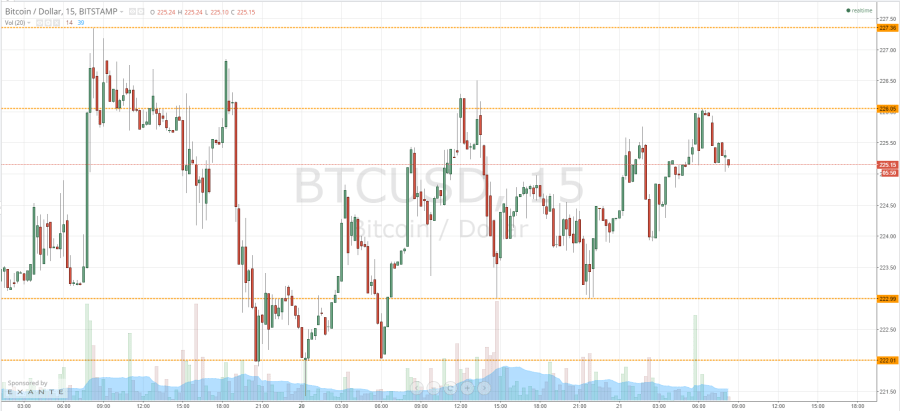
Yesterday afternoon, shortly before the European markets closed out the day, we published our twice-daily bitcoin price analysis piece highlighting the action throughout Monday’s European session and suggesting the levels that we would be looking at to help us infer a bias as we headed into the evening. Now action has matured throughout Monday evening, what are the levels we will be watching during Tuesday’s European session, and how can we interpret price action around these levels in order to use their inference to enter a position? Take a quick look at the chart.
As the chart shows, action overnight was a bit choppy, but the overarching momentum was to the upside. We are now looking at in term support 222.99 and resistance at 226.05 as the levels we will use to infer our bias on an intraday basis. If we can get a break above 226.05, and a close above this level, we will look to enter long with an initial upside target of 227.50 – a tight trade, and one that requires a tight stop (somewhere around 225.5) but one that could warrant entry for a quick upside profit if we do get a break.
Bitcoin Price Watch – Conclusory Note
Conversely, if we bounce from 226.05, we will look for a run down towards 222.99 as an aggressive range bound trade. In this scenario, a stop somewhere around 227 flat would give us a nice risk reward profile. If we get a break below 222.99, it would validate 222 flat as a secondary downside target. One thing to bear in mind is that – with the recent choppy action – it’s important to keep a firm hold on your risk management. Entering a trade without a stop loss in place could mean you find yourself on the wrong side of a sharp spike, and in turn, irretrievable losses.
Charts courtesy of Trading View


