Reason to trust

How Our News is Made
Strict editorial policy that focuses on accuracy, relevance, and impartiality
Ad discliamer
Morbi pretium leo et nisl aliquam mollis. Quisque arcu lorem, ultricies quis pellentesque nec, ullamcorper eu odio.
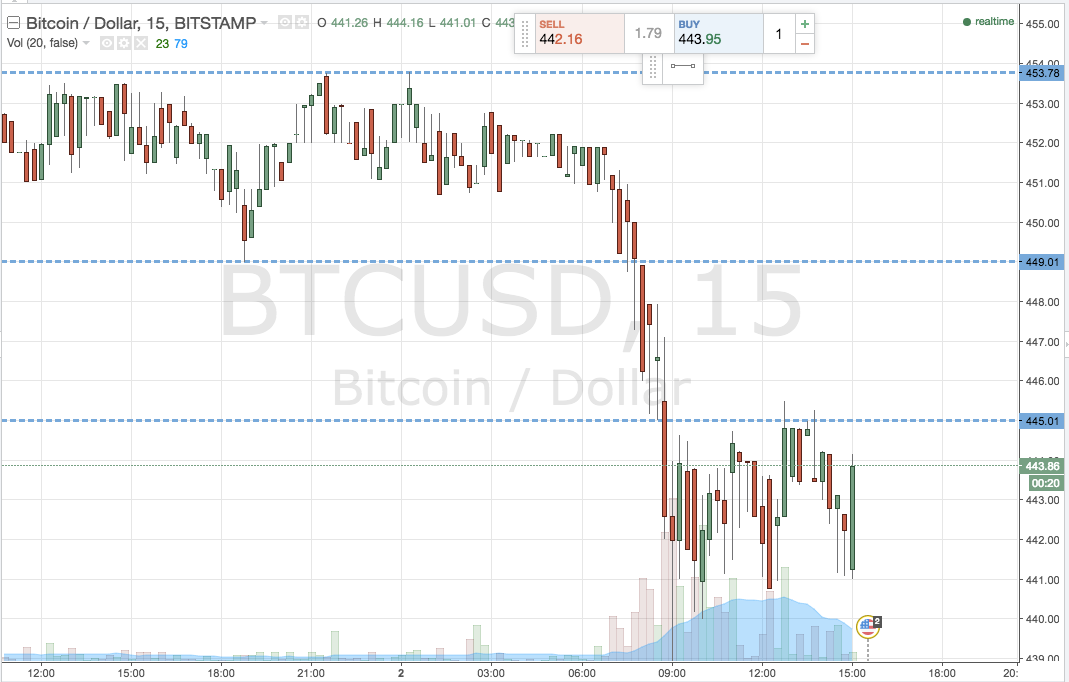
Let’s kick things off with a chart. The chart below highlights the action seen in the bitcoin price throughout today’s session, and has the framework we placed onto action earlier this morning overlaid. It’s a fifteen-minute candlestick.

So, as the chart shows, having declined considerably overnight, the bitcoin price found support at a little ahead of 438, before correcting to the upside to trade in a pretty tight 440-444 range. This range has dominated action today, and gives us something to go at this evening, and beyond, into the Asian session tonight.
Also of note is the completion of our downside trade, with the position closing out for a nice short side profit on the sustained run seen before the aforementioned consolidation. We entered on the break of then-resistance at 445 flat, with a target of 440, and closed out for a nice $5 per-lot profit.
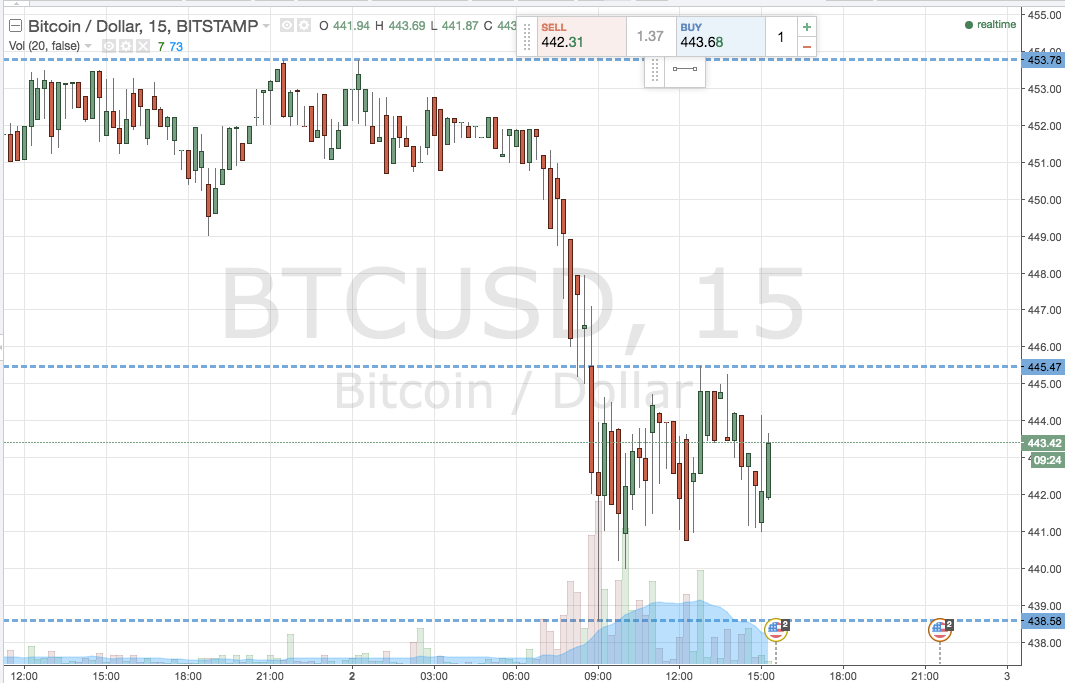
So, with this out of the way, what are we looking at in the bitcoin price this evening, and where can we look to get in and out of the markets if we get a repeat of the day’s volatility? Take a quick look at the chart below to get an idea of this evening’s parameters.

The range we are looking at is the one alluded to a little earlier – with support defined by the most recent swing low at 438.58, and resistance to the upside at 445 flat. There’s just enough room for an intrarange trade, so long on a bounce form support, short on a correction from resistance, stop just the other side of the entry to ensure we are taken out of the trade if price reverses into a breakout.
With breakout, a close above resistance signals long towards 450, with a stop at 442 defining risk on the position. A close below support signals short towards 433, stop at 440 flat limits our upside.
Happy Trading!
Charts courtesy of Trading View
Header Image Courtesy of NewsBTC All Rights Reserved


