Reason to trust

How Our News is Made
Strict editorial policy that focuses on accuracy, relevance, and impartiality
Ad discliamer
Morbi pretium leo et nisl aliquam mollis. Quisque arcu lorem, ultricies quis pellentesque nec, ullamcorper eu odio.
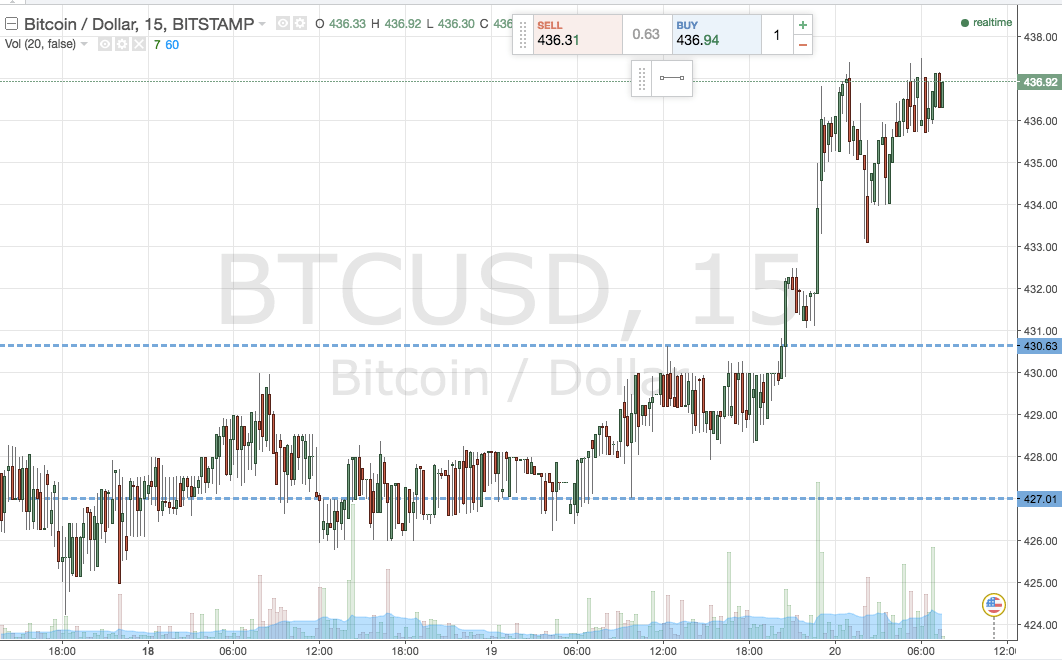
The chart below is the chart we used for the second of last night’s analyses, but zoomed out a little to highlight the action that we saw overnight in the bitcoin price. It’s a fifteen-minute candlestick chart that shows the last forty-eight hours or so worth of action in the bitcoin price.

As you can see from the chart, we finally got some decent action overnight. A breakout to the upside, followed by a sustained run in the direction of the break, took us to a target hit not just in the trade we went into yesterday evening already holding, but also in the fresh one that we held as a result of the breakout. A nice way to head into the Wednesday session, for sure.
Whether we will see further upside today remains to be seen. We are at the highest levels seen in a while, and oftentimes we see a correction from fresh highs (at least medium term) while short term speculators – such as ourselves, in this instance – take profits on scalp positions.
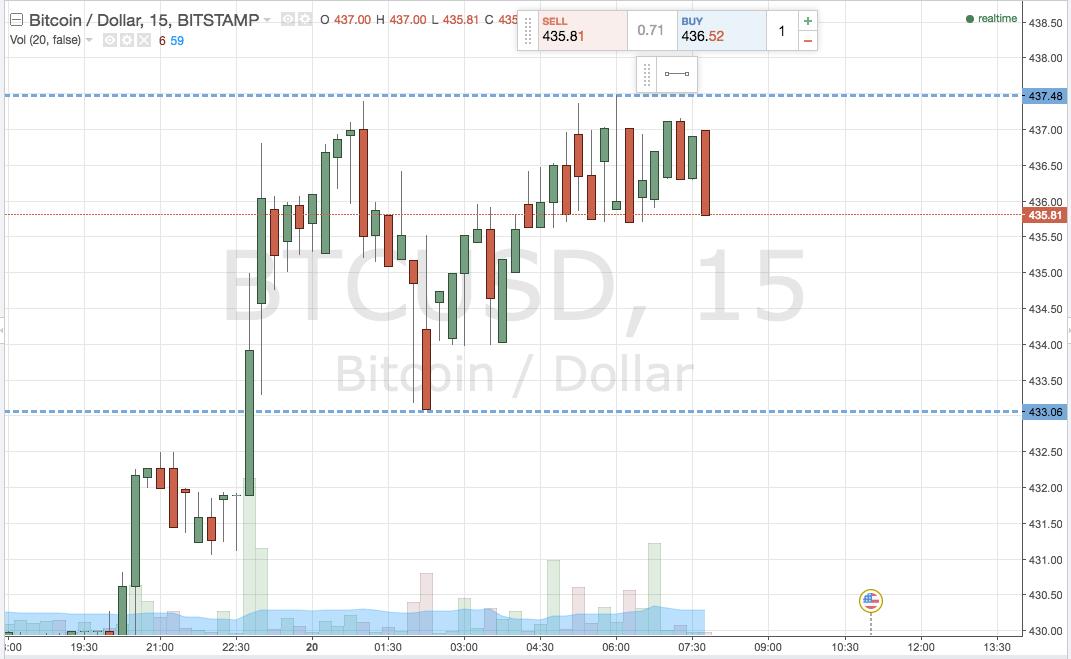
This isn’t set in stone, however, and since both of our trades have run to completion, we are now net flat in the market. With this in mind, here’s a look at how we are going to approach the bitcoin price this morning in Europe. The chart below highlights the refined range, i.e. the range that takes into account overnight action.

As the chart shows, the range we are now looking at is defined by in term support at 433 flat, and in term resistance at 437.5. We’ll be focusing on breakout only for the session.
So what’s our strategy?
As ever, a close to the upside above in term resistance will signal a long entry, in this instance, towards an upside target of 442 flat. A stop at 436 defines risk.
Looking the other way, a close below support signals short towards 428 flat, with a stop at 435 to define risk on the position.
Charts courtesy of Trading View


