Reason to trust

How Our News is Made
Strict editorial policy that focuses on accuracy, relevance, and impartiality
Ad discliamer
Morbi pretium leo et nisl aliquam mollis. Quisque arcu lorem, ultricies quis pellentesque nec, ullamcorper eu odio.
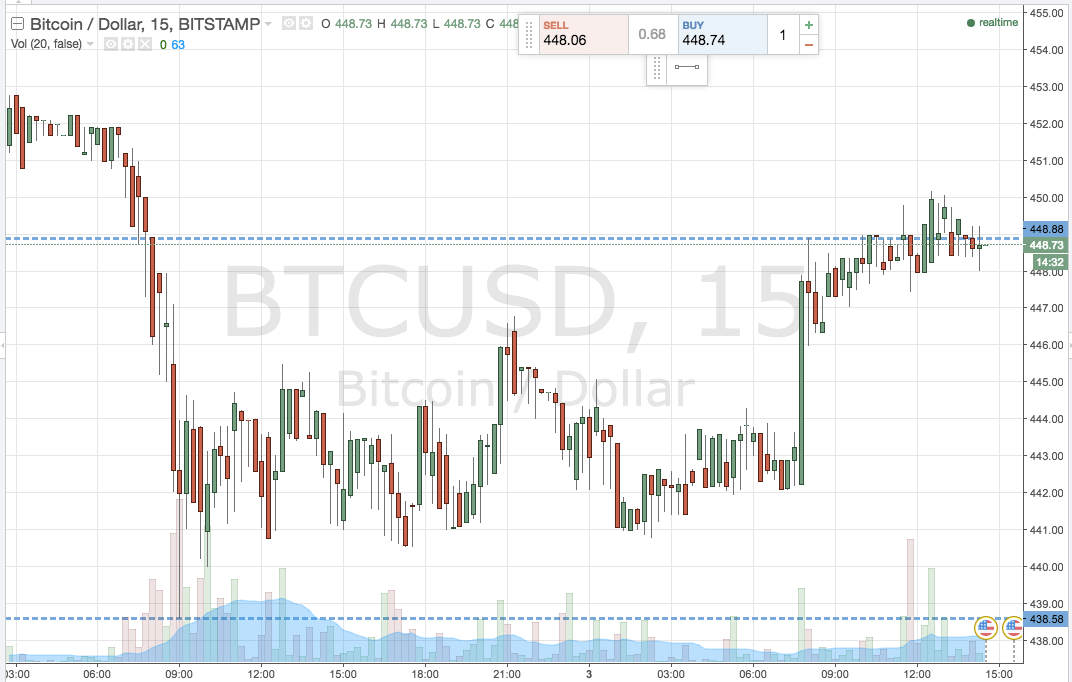
Its coming to the end of yet another day’s trading in the bitcoin price, and as the European session draws to a close, let’s take a look at what we saw in today’s action, and how we can interpret this action into something tangible for tonight’s bitcoin price trading strategy. First up, take a quick look at the chart below to get an idea of what happened today.

As this first chart shows, action has been relatively muted, but we have managed to get into an upside position on a break of resistance a little earlier and we remain in that trade as things stand. For this reason, we wont be entering any fresh trades this evening – that is, at least, until the current trade closes out, be it for a loss of a profit.
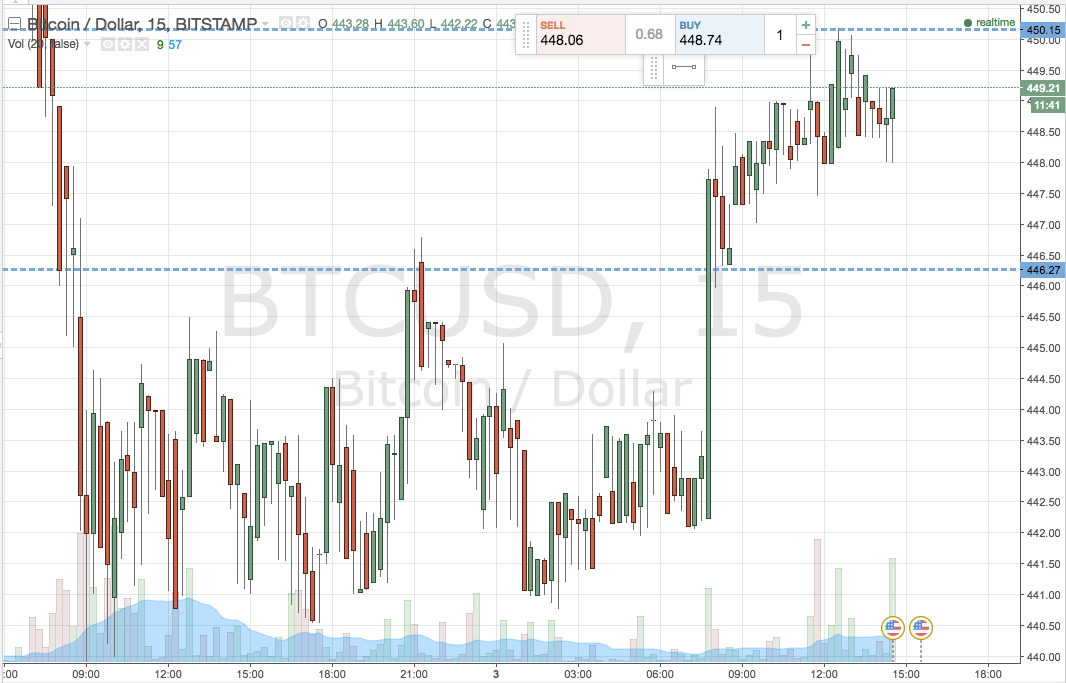
With that out of the way, take a look at the second chart below. For those not yet in a position, the chart shows our refined range (to take into consideration today’s action) and our profit taking and risk management parameters for this evening’s session. As ever, it’s an intraday, fifteen-minute candlestick chart.

As the second chart highlights, the range we are looking at this evening is narrowed slightly on this morning’s and as a result, we will be looking at a breakout strategy only for now.
In term support comes in at 446.27 to the downside, while in term resistance sits at 450 flat to the upside.
A break above in term resistance will signal a long entry towards an initial upside target of 455 flat. We’d like to see price run up in this direction, as it will mean a concurrent taking out of our upside profit target on the live trade.
Looking the other way, if price breaks and closes below support it will put us short towards 440 flat. A stop on this one at 448 defines risk.
Charts courtesy of Trading View


