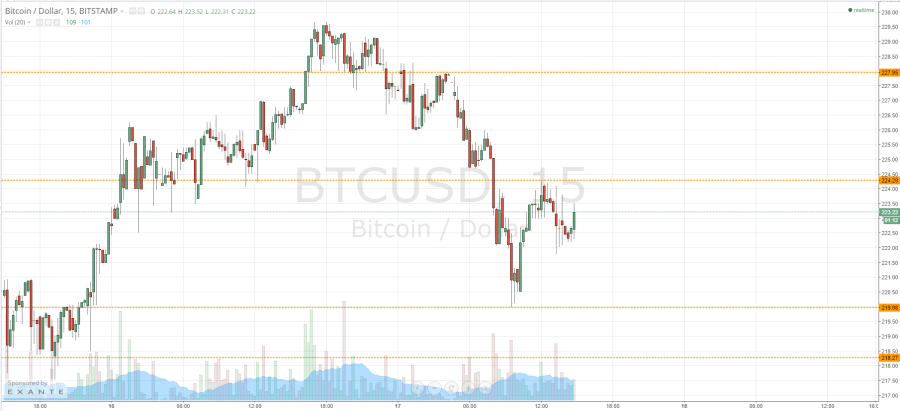
A little earlier on today we published our twice-daily bitcoin price watch piece, highlighting the levels we were looking at in the bitcoin price and suggesting how we might react to price reaching these levels as far as entering long or short positions was concerned. Now action has matured throughout the European session, and we are heading into the weekend, what will we be keeping an eye on, and the breaking of which levels will signal entry for us? Take a quick look at the chart.
While we are primarily looking to the downside this week, and a break in this direction compounded this bias earlier this morning, we found a floor at 219.98 from which we bounced to swing highs at 224.29, with these levels serving as in term support at in term resistance respectively as we head into the weekend.
If we can get a run towards 224.29, we will look for a break above this level to signal a bullish entry with an initial target of 227.95, and a stop just below 223.50 ensuring we are taken out of the trade in the event of a bias reversal.
Conversely, a run back down towards 219.98 (in term support), and a break below this level on the intraday basis, would signal a short entry towards 218.27. In order to maintain a favourable risk reward profile on this trade, we would need a very tight stop, somewhere around 220.50- 221 flat mark.
If we don’t break in term support, and we get a bounce (as we saw already earlier today), we will enter long on a range strategy trade, with a stop just below 219 flat and a medium-term upside target of in term resistance at the aforementioned 224.29.
Charts courtesy of Trading View