Reason to trust

How Our News is Made
Strict editorial policy that focuses on accuracy, relevance, and impartiality
Ad discliamer
Morbi pretium leo et nisl aliquam mollis. Quisque arcu lorem, ultricies quis pellentesque nec, ullamcorper eu odio.
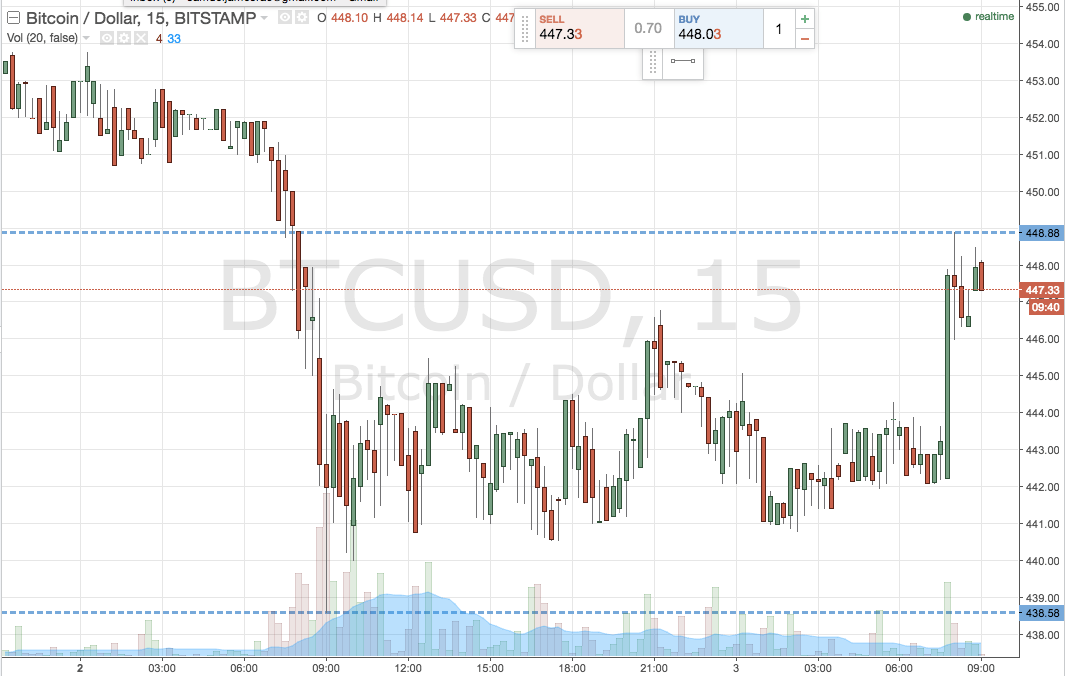
After yesterday’s steep decline in the bitcoin price, we got a period of drawn out consolidation thorughout Monday afternoon and early evening. The consolidation came about as a result of profit-taking on the short side, and likely, some counter positions being taken in anticipation of a long-term reversal. Action has now matured over night, so, as we head into a fresh European session on Tuesday, what are the levels that we are watching today, and where will we look to get in and out of the markets according to our intraday strategy? Take a quick look at the chart to get an idea of what we’re focusing on.

As the chart shows, we have widened out our standard range a little bit, and it is now defined by support to the downside at 438, and resistance to the upside at 449. The latter of these levels represents the most recent swing high, which price reached just a little earlier this morning.
We have about $10 worth of range to play with, so that’s plenty of room to go at action with an intrarange approach. In light of this, a bounce from support will single a long trade towards an initial upside target of resistance, while a stop loss on this position somewhere around 436 will define our downside risk. Conversely, a correction from resistance (this is looking more likely given current levels) will signal short towards support. A stop loss at 451 keeps things tight to the upside.
Looking at action from a breakout perspective, if price closes above resistance we will look to enter a long trade towards a target of 455. On this one, a stop loss somewhere in the region of 446 helps is to maintain a positive risk reward profile. Looking short, a close below support signals a downside position towards 432. Stop loss at 441.
Charts courtesy of Trading View


