Reason to trust

How Our News is Made
Strict editorial policy that focuses on accuracy, relevance, and impartiality
Ad discliamer
Morbi pretium leo et nisl aliquam mollis. Quisque arcu lorem, ultricies quis pellentesque nec, ullamcorper eu odio.
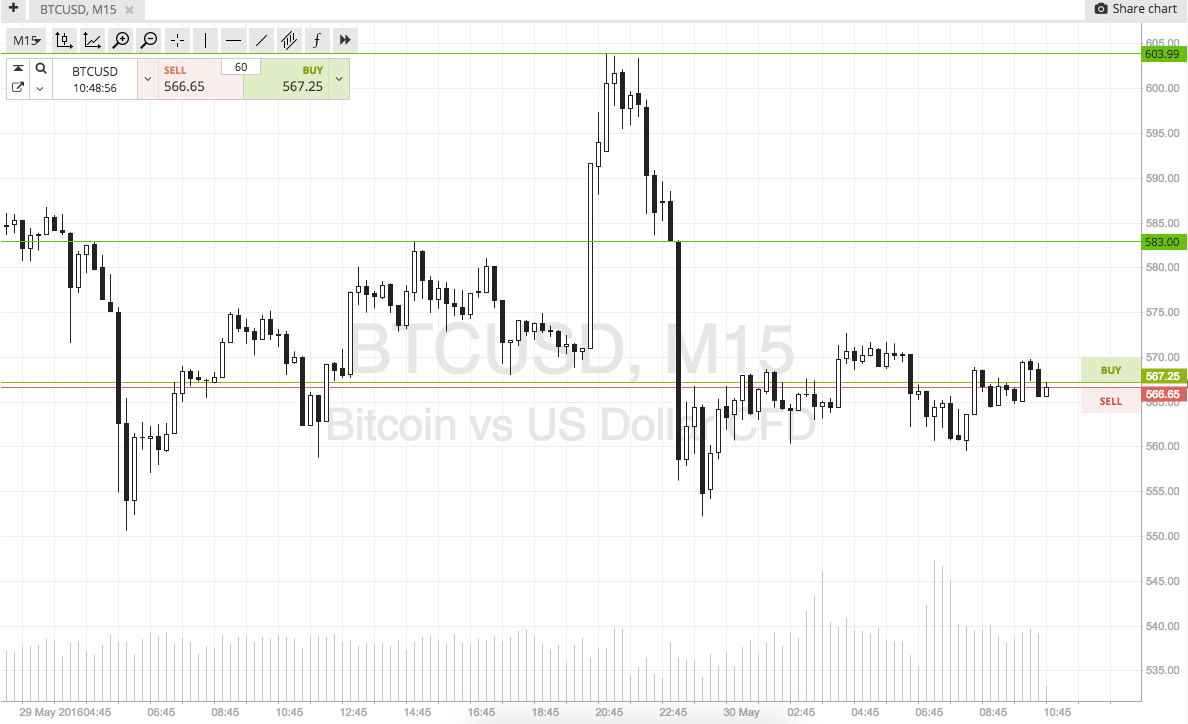
It’s been an interesting few weeks in the bitcoin price market, and we’ve had the opportunity to get in and out according to each iteration of our intraday strategy on a number of occasions. The weekend has now drawn to a close, and we are about to head into a fresh week with the beginning of the European session. With this in mind, and as volume starts to filter into the market, what are we looking at for today’s morning European session in Europe, and where will we look to get in and out of the markets if we get a repeat of the volatility we saw towards the end of last week? To get an idea of what we’re watching, and what we are looking to trade, get a look at the chart below. It’s an intraday, fifteen-minute candlestick chart that shows the last forty eight hours worth of action in the bitcoin price – that is, action seen over the weekend and early this morning.

As the chart shows, the levels we are focusing on this morning, and the ones that define today’s range, are in term support at 583 and in term resistance to the upside at 604 flat.
Looking at things from a breakout perspective, if price runs up towards support, we will look for a close and a break above this level to validate an immediate upside entry towards a target of 610. It’s a pretty tight target, so we’ll need a reasonably tight stop loss on the trade. Somewhere in the region of 602 looks good for this one.
Looking south, a close below in term support will signal a short position towards a downside target of 576. A stop loss on this one somewhere around 585 keeps things attractive from a risk management perspective.
Charts courtesy if SimpleFX
Header Image via NewsBTC


