
Reason to trust
How Our News is Made
Strict editorial policy that focuses on accuracy, relevance, and impartiality
Ad discliamer
Morbi pretium leo et nisl aliquam mollis. Quisque arcu lorem, ultricies quis pellentesque nec, ullamcorper eu odio.
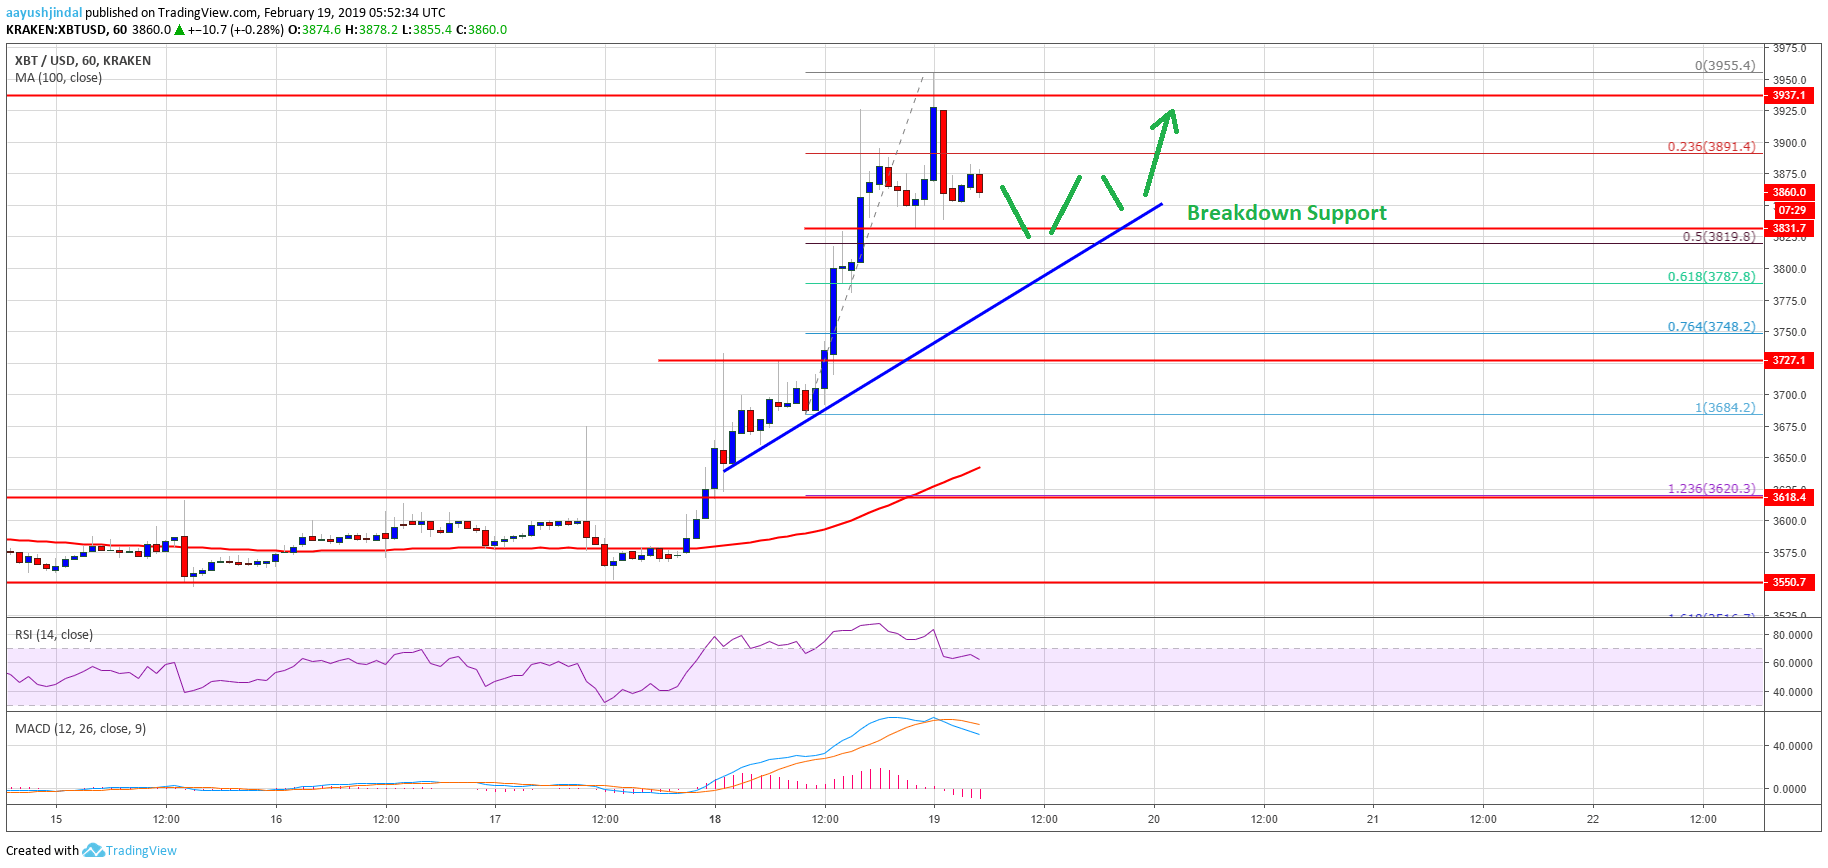
- Bitcoin price surged and broke the $3,720 and $3,880 resistance levels against the US Dollar.
- The price traded close to the $4,000 resistance level and a new weekly high was formed at $3,955.
- There is a connecting bullish trend line formed with support at $3,800 on the hourly chart of the BTC/USD pair (data feed from Kraken).
- The pair corrected lower, but dips remain well supported above $3,800 and $3,720.
Bitcoin price rallied above the key $3,800 resistance against the US Dollar. BTC could move into a medium term uptrend if there is a successful daily close above $4,000 and $4,200.
Bitcoin Price Analysis
In the last couple of analysis, we discussed the chances of bitcoin price hitting the $4,000 level against the US Dollar. The BTC/USD pair did gain bullish momentum recently and broke the $3,650 and $3,720 resistance levels. There was a clear bullish break noted above the $3,800 resistance and the 100 hourly simple moving average. The main driving force was Ethereum, which rallied recently towards the $150 resistance level. It helped BTC to climb towards the $4,000 resistance area. A high was formed at $3,955 and later the price started a downside correction.
It declined below the $3,900 support and the 23.6% Fib retracement level of the last wave from the $3,553 low to $3,732 high. Sellers pushed the price towards the $3,840 level (the previous swing low), where buyers emerged. On the downside, there are many supports near the $3,800 level. More importantly, there is a connecting bullish trend line formed with support at $3,800 on the hourly chart of the BTC/USD pair. Besides, the 50% Fib retracement level of the last wave from the $3,553 low to $3,732 high is near the $3,819 level.
If there is a downside break below the $3,800 support, the price could test the $3,720 support level. An intermediate support is $3,750 and the 76.4% Fib retracement level of the last wave from the $3,553 low to $3,732 high. Therefore, dips remain well supported as long as the price stays above the $3,720 pivot level.
Looking at the chart, bitcoin price is placed nicely in an uptrend above $3,800. On the upside, an initial resistance is at $3,950 and $4,000. However, the main resistance is at $4,200, where sellers could emerge. On the positive note, if there is a successful daily close above $4,000 and $4,200, the price is likely to start a medium term uptrend.
Technical indicators
Hourly MACD – The MACD is slowly gaining pace in the bearish zone, but with limited strength.
Hourly RSI (Relative Strength Index) – The RSI for BTC/USD corrected lower, but it is still above the 60 level.
Major Support Level – $3,820 followed by $3,800.
Major Resistance Level – $3,950 and 4,000.


