
Reason to trust
How Our News is Made
Strict editorial policy that focuses on accuracy, relevance, and impartiality
Ad discliamer
Morbi pretium leo et nisl aliquam mollis. Quisque arcu lorem, ultricies quis pellentesque nec, ullamcorper eu odio.
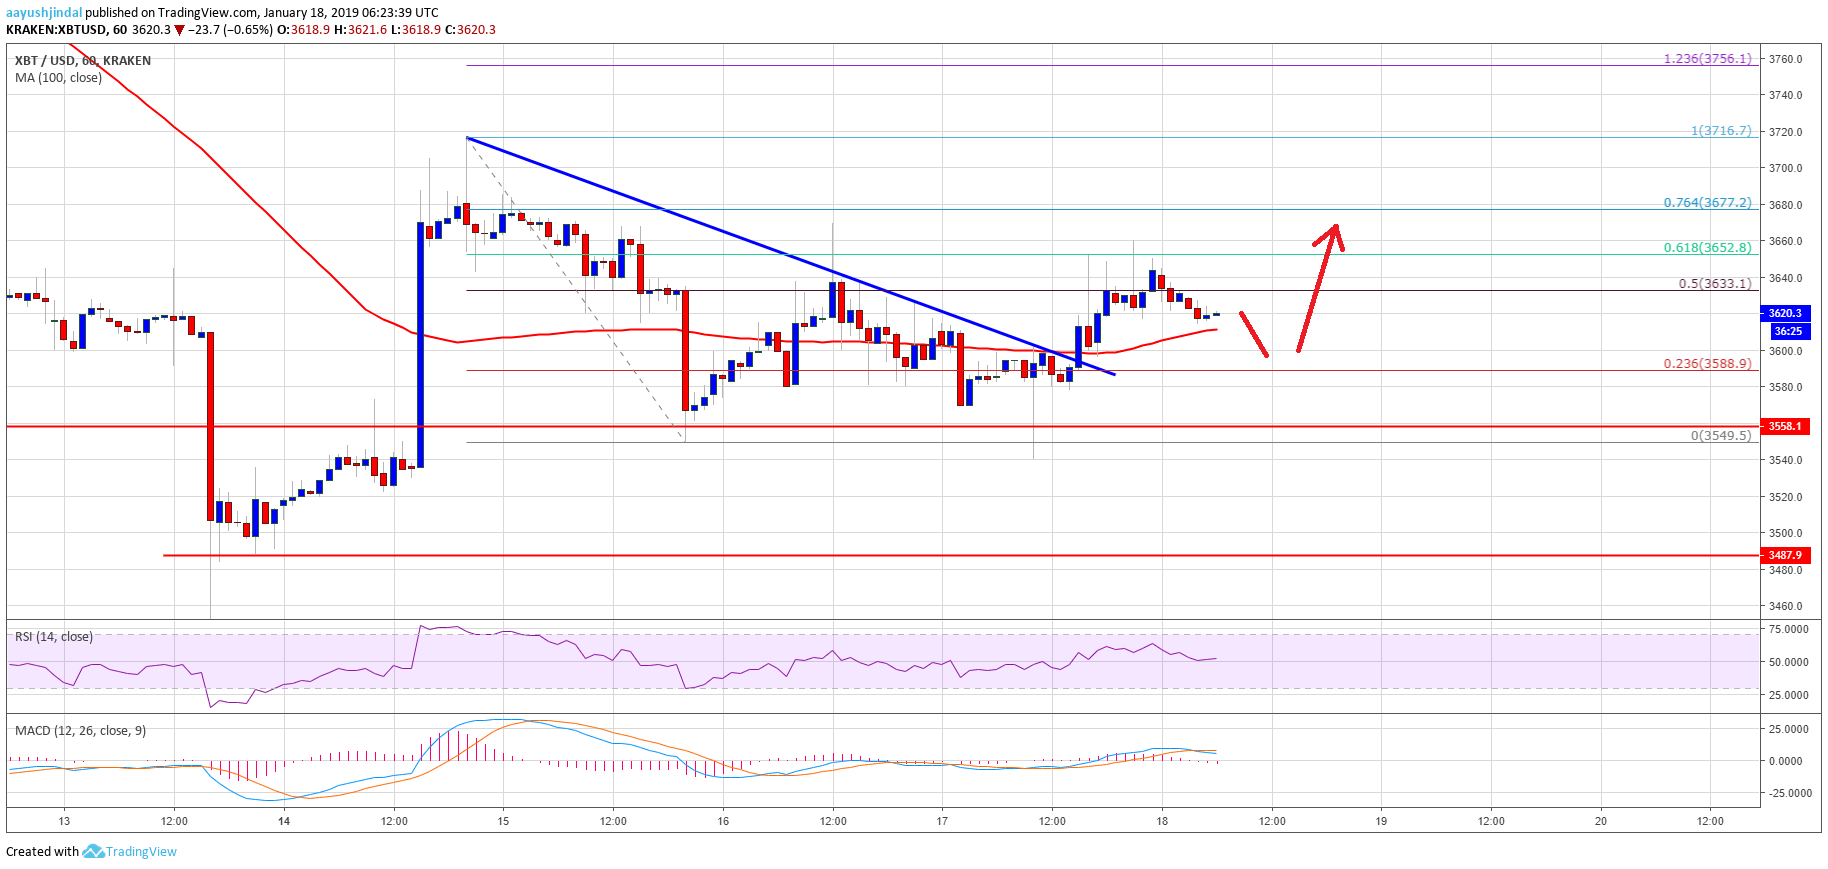
- Bitcoin price declined again and tested the $3,550 support area before recovering against the US Dollar.
- There was a break above a major bearish trend line with resistance at $3,585 on the hourly chart of the BTC/USD pair (data feed from Kraken).
- The price is currently showing positive signs above the $3,600 support level, with a bullish angle.
Bitcoin price broke a key resistance near $3,600 recently against the US Dollar. The current price action is positive, signaling an upside extension above $3,700 in the near term.
Bitcoin Price Analysis
There was yet another rejection near the $3,660 resistance in bitcoin price against the US Dollar. The BTC/USD pair dipped below $3,600 and retested the key $3,550 support area. Buyers protected the $3,550 support and the price bounced back. It climbed above the $3,580 and $3,600 resistance levels, signaling a decent recovery. There was also a break above the 50% Fib retracement level of the recent decline from the $3,715 swing high to $3,549 low. More importantly, there was a close above $3,600 and the 100 hourly simple moving average.
Finally, there was a break above a major bearish trend line with resistance at $3,585 on the hourly chart of the BTC/USD pair. These all are positive signs above the $3,600 level and the 100 hourly SMA. However, the price seems to be facing a solid resistance near the $3,650-3,660 levels. It coincides with the 61.8% Fib retracement level of the recent decline from the $3,715 swing high to $3,549 low. Therefore, a proper close above the $3,660 resistance could clear the path for more gains above $3,700. The next main resistance is at $3,715 and $3,730.
Looking at the chart, bitcoin price clearly made a nice upward move above the $3,600 level. Having said that, a beak above $3,660 is must for more gains. If not, there is a risk of a fresh drop towards the $3,550 and $3,540 support levels.
Technical indicators
Hourly MACD – The MACD for BTC/USD is slowly moving in the bearish zone.
Hourly RSI (Relative Strength Index) – The RSI for BTC/USD is holding the 50 level, with a positive angle.
Major Support Level – $3,550
Major Resistance Level – $3,660


