
Reason to trust
How Our News is Made
Strict editorial policy that focuses on accuracy, relevance, and impartiality
Ad discliamer
Morbi pretium leo et nisl aliquam mollis. Quisque arcu lorem, ultricies quis pellentesque nec, ullamcorper eu odio.
Key Points
- Bitcoin price declined further and broke the $3,295 and $3,200 supports against the US Dollar.
- There was a break below a major contracting triangle with support at $3,355 on the hourly chart of the BTC/USD pair (data feed from Kraken).
- The price traded to a new weekly low at $3,150 and it is currently correcting losses.
Bitcoin price declined below the $3,200 support recently against the US Dollar. BTC could continue to face a lot of selling interest near the $3,350 and $3,375 levels.
Bitcoin Price Analysis
Yesterday, we discussed the chances of a fresh weekly low below $3,200 in bitcoin price against the US Dollar. The BTC/USD pair did trade lower and broke the $3,295 and $3,260 support levels. The price even broke the $3,200 support area to signal a major bearish wave. A new weekly low was formed at $3,150 and it seems like the price remains in a significant downtrend.
During the decline, there was a break below a major contracting triangle with support at $3,355 on the hourly chart of the BTC/USD pair. The pair is now trading well below the $3,400 level and the 100 hourly simple moving average. It recently corrected above the $3,230 level and the 23.6% Fib retracement level of the last slide from the $3,491 high to $3,150 low. However, buyers struggled to clear the $3,265-3,300 resistance zone. The next major hurdle is near the $3,360 level. It coincides with the 61.8% Fib retracement level of the last slide from the $3,491 high to $3,150 low. Besides, the triangle resistance trend line is at $3,375 to prevent gains.
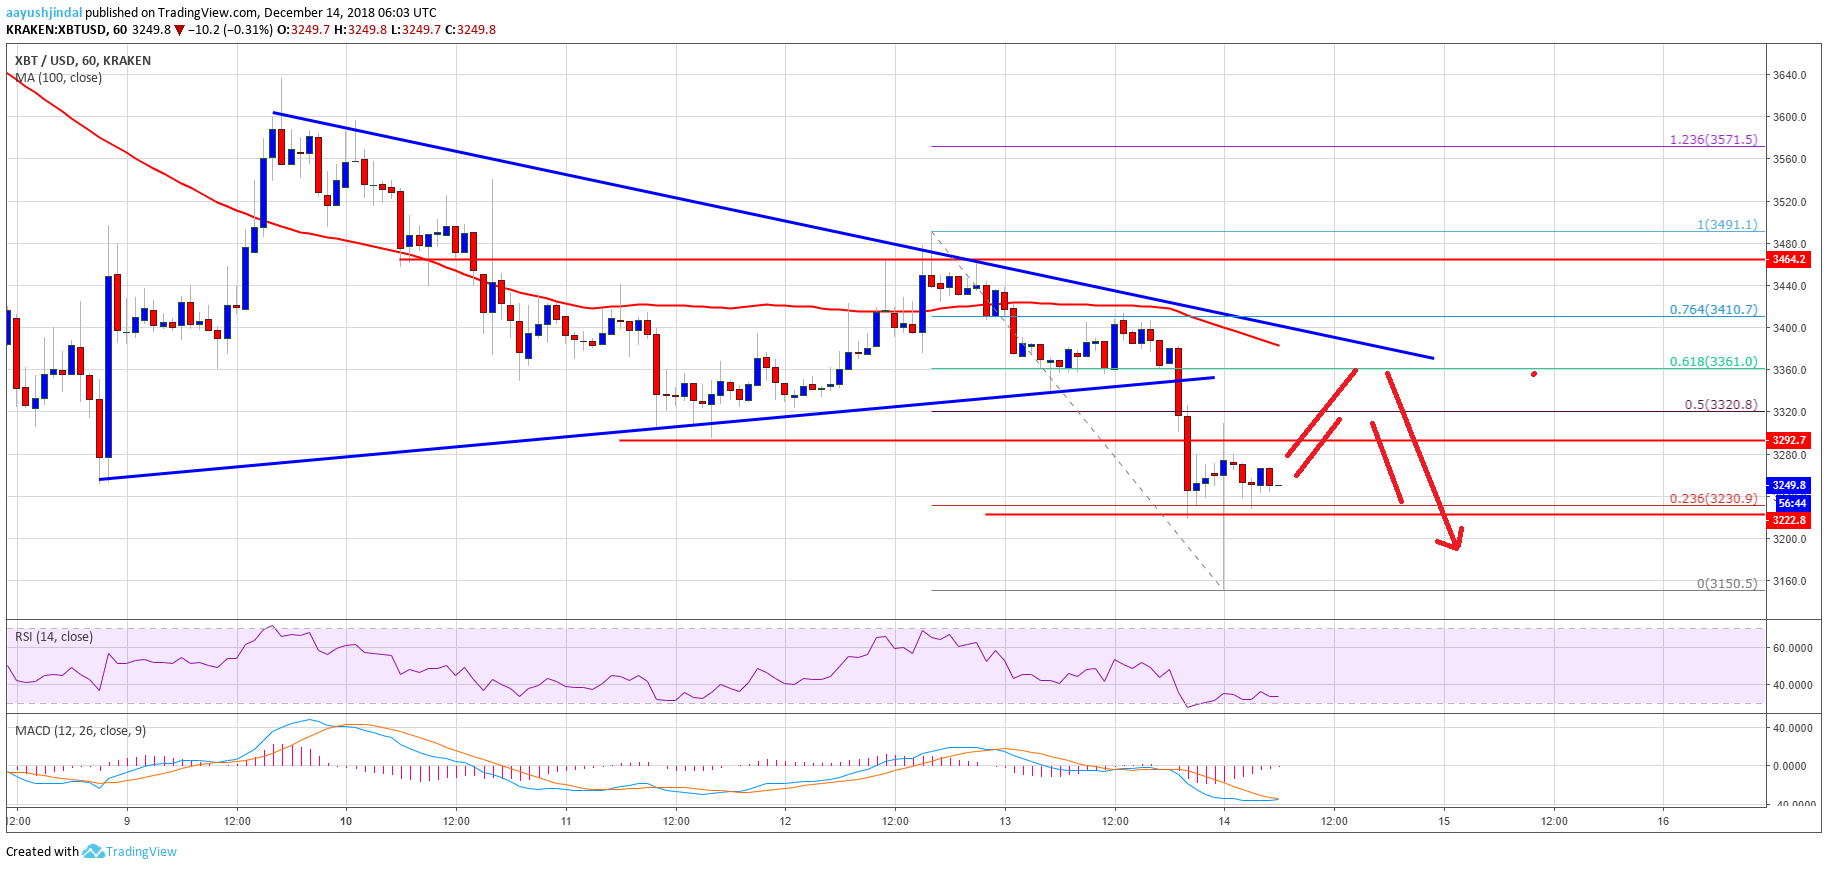
Looking at the chart, bitcoin price is clearly trading in a bearish zone below $3,375. There could be more losses below $3,150 and $3,000 in the near term.
Looking at the technical indicators:
Hourly MACD – The MACD for BTC/USD is slowly reducing its bearish slope.
Hourly RSI (Relative Strength Index) – The RSI is still well below the 40 level.
Major Support Level – $3,200
Major Resistance Level – $3,375


