
Reason to trust
How Our News is Made
Strict editorial policy that focuses on accuracy, relevance, and impartiality
Ad discliamer
Morbi pretium leo et nisl aliquam mollis. Quisque arcu lorem, ultricies quis pellentesque nec, ullamcorper eu odio.
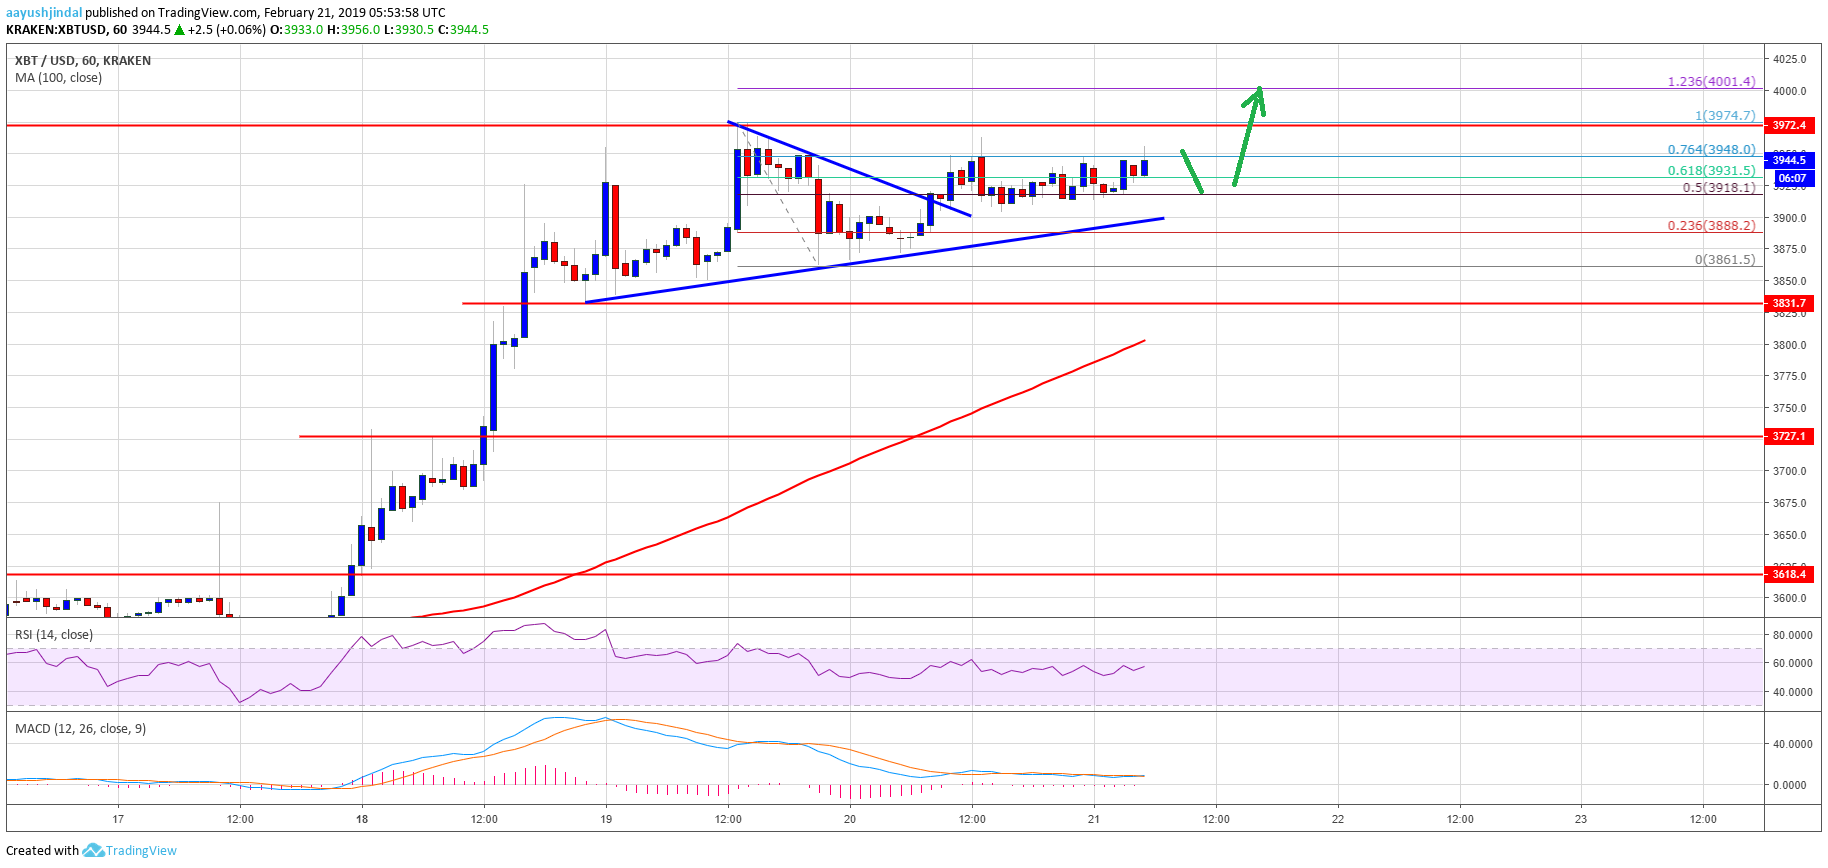
- Bitcoin price is well supported on the downside near the $3,900 and $3,850 supports against the US Dollar.
- The price is likely to accelerate gains above the $3,975 and $4,000 resistance levels.
- There is a major bullish trend line formed with support at $3,900 on the hourly chart of the BTC/USD pair (data feed from Kraken).
- The pair could dip a few points, but buyers are likely to protect declines below $3,850.
Bitcoin price is likely setting up for the next break above $4,000 against the US Dollar. BTC could gain bullish momentum towards $4,200 if it succeeds in surpassing the $4,000 resistance.
Bitcoin Price Analysis
Yesterday, we saw a minor downside correction from the $3,975 swing high in bitcoin price against the US Dollar. The BTC/USD pair traded below the $3,900 support level, but it found support near the $3,860 level. Later, it formed a support base above $3,860 and finally started a fresh upward move. It broke the 50% Fib retracement level of the recent decline from the $3,974 high to $3,861 low. Besides, there was a break above a connecting bearish trend line at $3,900 on the hourly chart of the BTC/USD pair.
The pair settled above the $3,920 level and traded close to the $3,950 resistance. BTC tested the 76.4% Fib retracement level of the recent decline from the $3,974 high to $3,861 low. It is currently consolidating below $3,950, with a bullish angle. The current price action is positive and it seems like there could be more gains above $3,950 and $3,975. However, a successful break above the $4,000 resistance is must for an upside acceleration. The next key resistance is near $4,180 and $4,200 levels.
On the downside, the main support is near the $3,900 level. There is also a major bullish trend line formed with support at $3,900 on the same chart. Should BTC decline below the trend line, it could test the $3,860 and $3,830 support levels. The final support is at $3,800 and the 100 hourly simple moving average. Below the 100 hourly SMA, the price could decline towards $3,720.
Looking at the chart, bitcoin price is clearly trading with a bullish bias above the $3,900 and $3,860 supports. Therefore, there are high chances of more upsides above the $3,975 and $4,000 resistance. Buyers could aim for $4,200 if there is a successful hourly close above the $4,000 barrier in the near term.
Technical indicators
Hourly MACD – The MACD is slowly gaining strength in the bullish zone.
Hourly RSI (Relative Strength Index) – The RSI for BTC/USD is currently well above the 50 level, with a positive angle.
Major Support Level – $3,900 followed by $3,860.
Major Resistance Level – $3,950. $3,975 and 4,000.


