
Reason to trust
How Our News is Made
Strict editorial policy that focuses on accuracy, relevance, and impartiality
Ad discliamer
Morbi pretium leo et nisl aliquam mollis. Quisque arcu lorem, ultricies quis pellentesque nec, ullamcorper eu odio.
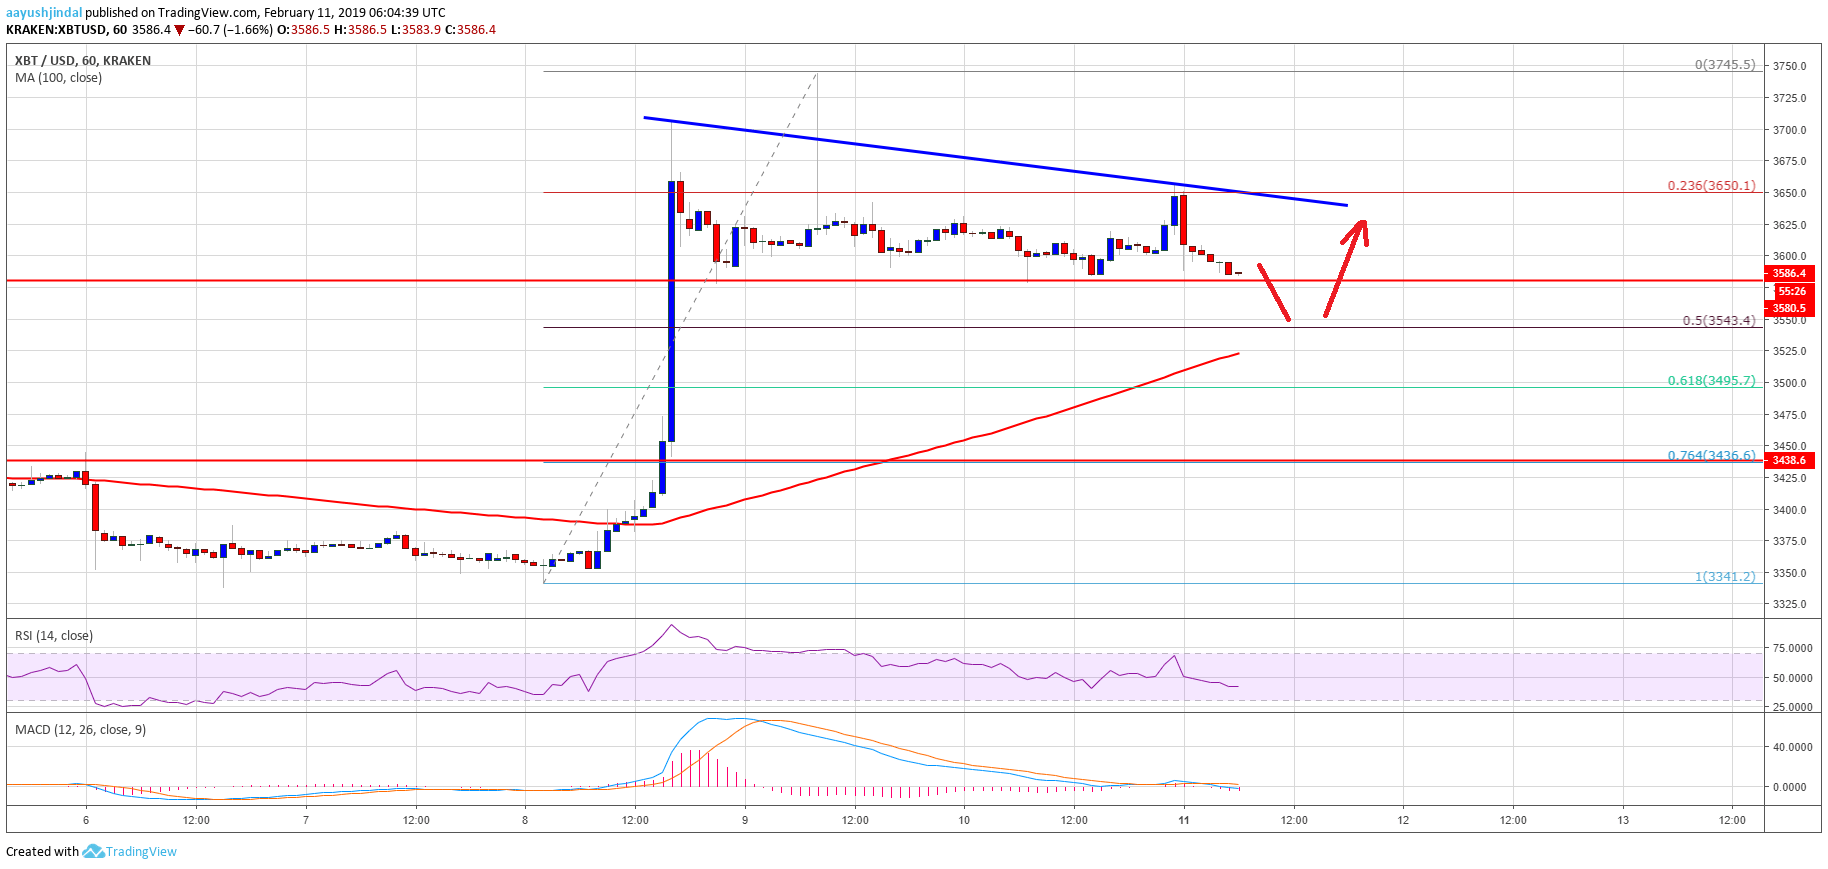
- Bitcoin price rallied towards the $3,750 level and later started a downside correction against the US Dollar.
- There is a key bearish trend line formed with resistance at $3,640 on the hourly chart of the BTC/USD pair (data feed from Kraken).
- The price is likely to correct lower towards the $3,550 or $3,500 support levels before a fresh rally.
Bitcoin price climbed higher and settled above the $3,500 resistance against the US Dollar. BTC is currently correcting lower, but dips remain supported above the 100 hourly SMA.
Bitcoin Price Analysis
In the weekly analysis, we saw a solid upward move above $3,500 in bitcoin price against the US Dollar. The BTC/USD pair even broke the $3,600 and $3,650 resistance levels. A fresh yearly high was formed at $3,745 and the price settled above the 100 hourly simple moving average. Later, the price started a downside correction and traded below the $3,700 and $3,650 levels. There was a break below the 23.6% Fib retracement level of the last wave from the $3,341 low to $3,745 high.
At the moment, the $3,580 level is acting as a strong support. If there is a downside break, the price could test the $3,550 support level. It also coincides with the 50% Fib retracement level of the last wave from the $3,341 low to $3,745 high. More importantly, the 100 hourly simple moving average is positioned at $3,525 to act as a strong support. On the upside, an initial resistance is near the $3,625 level. There is also a key bearish trend line formed with resistance at $3,640 on the hourly chart of the BTC/USD pair. The pair must break the trend line and $3,650 for a fresh upward move.
Looking at the chart, bitcoin price is showing signs of a downside correction below $3,600. However, as long as the price is above the $3,550 and $3,500 support levels, buyers remain in action.
Technical indicators
Hourly MACD – The MACD moved back in the bearish zone, with a negative angle.
Hourly RSI (Relative Strength Index) – The RSI for BTC/USD is now well below the 50 level, with a bearish bias.
Major Support Level – $3,550
Major Resistance Level – $3,650


