Reason to trust

How Our News is Made
Strict editorial policy that focuses on accuracy, relevance, and impartiality
Ad discliamer
Morbi pretium leo et nisl aliquam mollis. Quisque arcu lorem, ultricies quis pellentesque nec, ullamcorper eu odio.
It’s been a few weeks since we were last able to use our intrarange strategy effectively, but as we kick off this fresh week in the bitcoin price, we may finally have an opportunity to do so. Price over the weekend turned out to be pretty volatile, and this volatility has opened up a decent sized range for us to take a look at.
Of course, we’ll also be bringing our breakout strategy to the table, in the hope that we get a breakout on the back of any intrarange volatility.
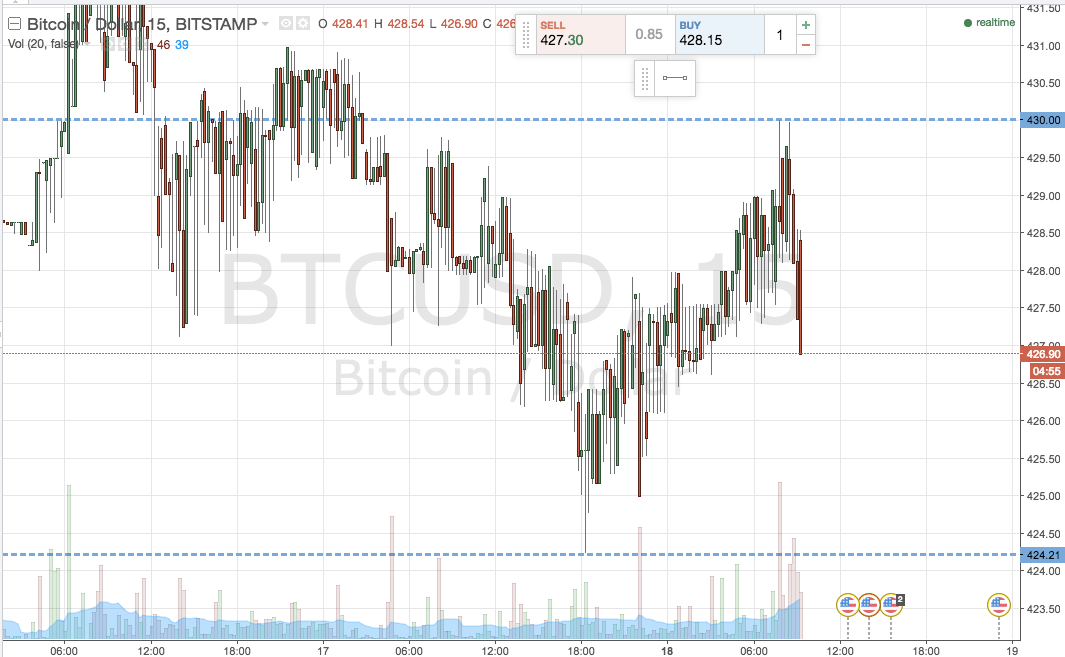
So, with this in mind, what did action over the weekend tell us about what we might expect to see in the bitcoin price today, and where are we looking to get in and out of the markets on our intraday strategies for the morning session out of Europe? To get an idea of the range we’re focusing on, take a look at the chart below. It’s a fifteen-minute candlestick chart showing the last circa forty-eight hours of action in the bitcoin price, with the range we are looking at overlaid.

As the chart shows, the range we are looking at is defined by in term support at 424 flat and in term resistance at 430 flat. These two levels are the most recent swing low and swing high respectively.
First then, intrarange. Long at support, short at resistance. Target the opposite level with a stop just the other side of entry (say, one or two dollars) to define risk on the position.
Breakout: long on a close above in term resistance with an initial upside target of 435 flat. Stop at 428 to keep risk tight. Short on a close below in term support towards a target of 4219 flat. A stop on this one somewhere in the region of 426 looks good.
Charts courtesy of Trading View


