Reason to trust

How Our News is Made
Strict editorial policy that focuses on accuracy, relevance, and impartiality
Ad discliamer
Morbi pretium leo et nisl aliquam mollis. Quisque arcu lorem, ultricies quis pellentesque nec, ullamcorper eu odio.
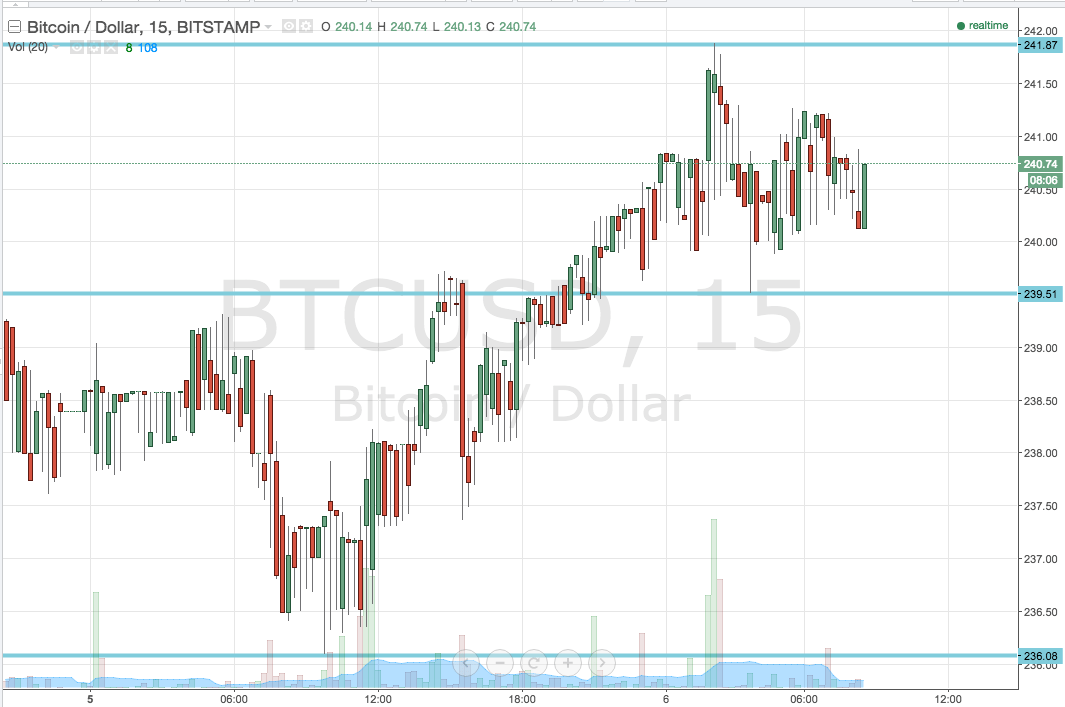
Its been a week or so since we last put out a bitcoin price watch piece, and during that time we’ve had some pretty volatile action in the markets. Bitcoin has seen a number of fundamental developments and, alongside some technical action, has as a result offered us plenty of opportunities to jump in and out of the markets according to our intraday strategy. So, with this said, and as we head into a fresh European day’s trading, what are the levels we are keeping an eye on today, and where will we look to draw a profit in the event that we get a continuation of the week’s volatility? Take a quick look at the chart to get an idea of today’s key levels.

As you can see, in term support for today’s session sits at 239.51 (overnight lows) while in term resistance comes in at 241.87 (weekly highs). One thing you will immediately notice is that this range is slightly narrower than we would normally trade. This is ok, it just takes our intra-range strategy off the table and brings in to play our breakout trades.
If we get some upside movement, we will look for a break above in term resistance, followed by a close above this level on the 15 minute chart, to validate an upside entry with an initial long target of 245 flat. A stop loss somewhere around 240 will keep things nice and tight from a risk management perspective.
Looking the opposite way – a break below 239.51 would put an end to the overarching bullish momentum we have experienced over the past few days, and a close below that level would put us short towards an immediate downside target of 235. Again a stop loss is necessary, and again somewhere around 240 would do nicely.
Charts courtesy of Trading View


